
Mathematics, 13.10.2020 03:01 jcox626
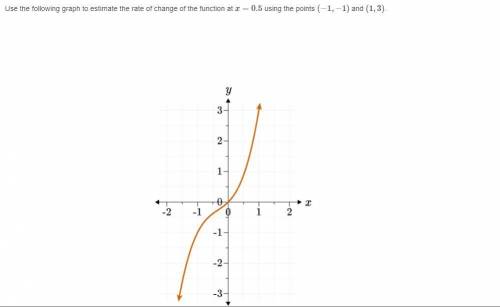
2.Use the following graph to estimate the rate of change of the function at x=0.5 using the points (−1,−1) and (1,3)
A. The rate of change is −1/2.
B. The rate of change is 2.
C. The rate of change is 1/2.
D. The rate of change is −2.
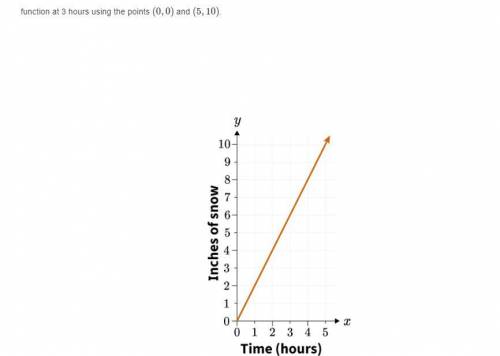
3.The following graph shows the inches of snow on the ground over a certain number of hours. Use the graph to estimate the rate of change of the function at 3 hours using the points (0,0) and (5,10)
A. The rate of change is −1/2 of an inch per hour.
B. The rate of change is 1/2 of an inch per hour.
C. The rate of change is 2 inches per hour.
D. The rate of change is −2 inches per hour.
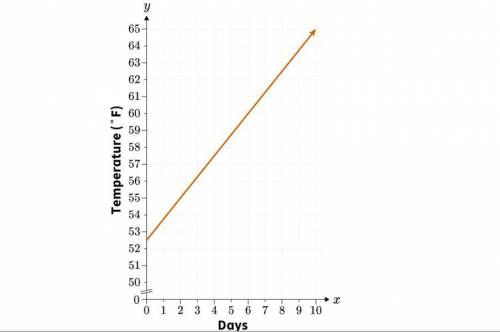
4.The following graph shows the average temperatures in degrees Fahrenheit (°F) over the days of a month. Use the graph to estimate the rate of change of the function at the ninth day of the month using the points (2,55) and (10,65)
A. The rate of change is 0.8 degrees Fahrenheit per day.
B. The rate of change is 1.25 degrees Fahrenheit per day.
C. The rate of change is −0.8 degrees Fahrenheit per day.
D. The rate of change is −1.25 degrees Fahrenheit per day.
5.Use the following graph to answer which of the following points would provide the most accurate estimation for the rate of change of the function as it crosses the y-axis. Explain.
(−0.5, 2)
(0.5, 3)
(−0.5, 3)
(0.5, 1)
A.(−0.5, 3) and (0.5, 1) would provide the most accurate estimation. The slope of the line drawn between these two points appears closest to the slope of the function at x=0.
B.(−0.5, 2) and (0.5, 3) would provide the most accurate estimation. The slope of the line drawn between these two points appears closest to the opposite of the slope of the function at x=0.
C.(−0.5, 2) and (0.5, 3) would provide the most accurate estimation. The slope of the line drawn between these two points appears closest to the slope of the function at x=0.
D.(−0.5, 3) and (0.5, 1) would provide the most accurate estimation. The slope of the line drawn between these two points appears closest to the opposite of the slope of the function at x=0.


Answers: 3


Other questions on the subject: Mathematics
Mathematics, 21.06.2019 20:20, redbeast677
The polynomial 10x3 + 35x2 - 4x - 14 is factored by grouping. 10x3 + 35x2 - 4x - 14 5x )-20 what is the common factor that is missing from both sets of parentheses?
Answers: 2
Mathematics, 21.06.2019 22:00, huangjianhe135
`if you have a set of parallel lines a and b cut by transversal x, if angle 1 = 167 degrees, what is angle 4 and why. also what is the measure of angle 5 and why? you need to use the names of the angle relationship and explain. ''.
Answers: 3
You know the right answer?
2.Use the following graph to estimate the rate of change of the function at x=0.5 using the points (...
Questions in other subjects:

History, 21.01.2021 19:00
Mathematics, 21.01.2021 19:00
Mathematics, 21.01.2021 19:00


English, 21.01.2021 19:00
Mathematics, 21.01.2021 19:00
Mathematics, 21.01.2021 19:00
Mathematics, 21.01.2021 19:00


