
Mathematics, 12.10.2020 23:01 Camill0310
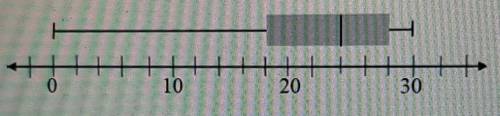
This box and whisker plot was made to represent how many days in a month employees at an office ate breakfast. Read the following pieces of data from the graph.
Range:
A. 18 B. 30 C. 24 D. 10
Median:
A. 24 B. 30 C. 15 D. 18

Answers: 2


Other questions on the subject: Mathematics
Mathematics, 21.06.2019 17:30, bradleycawley02
Lems1. the following data set represents the scores on intelligence quotient(iq) examinations of 40 sixth-grade students at a particular school: 114, 122, 103, 118, 99, 105, 134, 125, 117, 106, 109, 104, 111, 127,133, 111, 117, 103, 120, 98, 100, 130, 141, 119, 128, 106, 109, 115,113, 121, 100, 130, 125, 117, 119, 113, 104, 108, 110, 102(a) present this data set in a frequency histogram.(b) which class interval contains the greatest number of data values? (c) is there a roughly equal number of data in each class interval? (d) does the histogram appear to be approximately symmetric? if so, about which interval is it approximately symmetric?
Answers: 3
Mathematics, 21.06.2019 18:00, winterblanco
On saturday a souvenir shop had 125 customers. sixty four percent of the costumers paid with a credit card. how many costumers paid with cash?
Answers: 1
Mathematics, 22.06.2019 05:00, kamjay2006
Is a triangle with angle measures 46 degree,35 degree and 100 degree possible
Answers: 2
You know the right answer?
This box and whisker plot was made to represent how many days in a month employees at an office ate...
Questions in other subjects:

Law, 24.01.2021 04:50
Mathematics, 24.01.2021 04:50

English, 24.01.2021 04:50
Mathematics, 24.01.2021 04:50

Mathematics, 24.01.2021 04:50


