
Mathematics, 12.10.2020 19:01 Kazya4
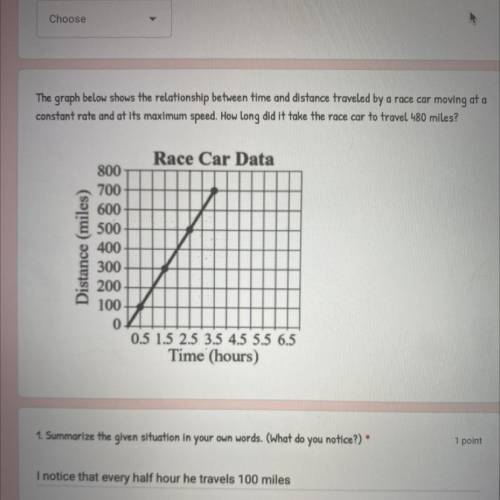
The graph below shows the relationship between time and distance traveled by a race car moving at a
constant rate and at its maximum speed. How long did it take the race car to travel 480 miles?
Race Car Data
Distance (miles)
800
700
600
500
400
300
200
100
0
0.5 1.5 2.5 3.5 4.5 5.5 6.5
Time (hours)

Answers: 1


Other questions on the subject: Mathematics
Mathematics, 21.06.2019 13:50, pedroramirezr2
Samantha swam upstream for some distance in one hour. she then swam downstream the same river for the same distance in only 12 minutes. if the river flows at 4 mph, how fast can samantha swim in still water?
Answers: 1
Mathematics, 21.06.2019 19:30, allicat133
Awater holding tank measures 105 m long, 50 m wide, and 8 m deep. traces of mercury have been found in the tank, with a concen- tration of 60 mg/l. what is the total mass of mercury in the tank? answer in units of kg.
Answers: 1
Mathematics, 21.06.2019 23:30, shreyapatel2004
What is the area of a triangle with a base of 7x and height of 8x expressed as a monomial? question 5 options: 1x 15x2 28x2 56x2
Answers: 1
You know the right answer?
The graph below shows the relationship between time and distance traveled by a race car moving at a...
Questions in other subjects:

Mathematics, 23.04.2021 07:00
Mathematics, 23.04.2021 07:00
Mathematics, 23.04.2021 07:00
Mathematics, 23.04.2021 07:00

English, 23.04.2021 07:00
Mathematics, 23.04.2021 07:00


