
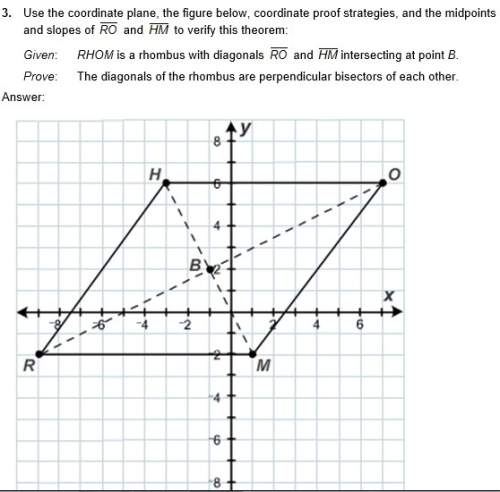
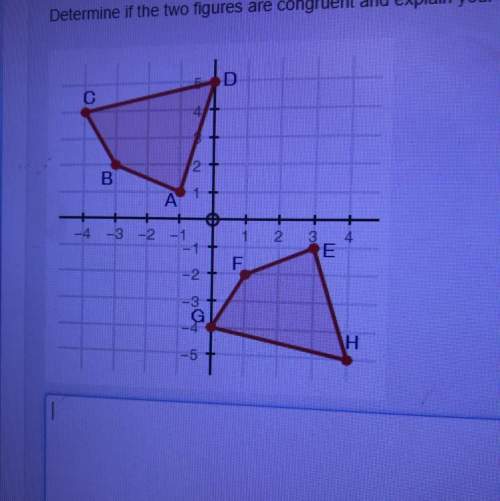
Mathematics, 11.10.2020 23:01 desiree98
An important variation of a histogram for categorical data is the Pareto chart. This chart is widely used in quality improvement efforts, and the categories usually represent different types of defects, failure modes, or product/process problems. The categories are ordered so that the category with the largest frequency is on the left, followed by the category with the second largest frequency, and so forth. These charts are named after the Italian economist V. Pareto, and they usually exhibit "Pareto’s law"; that is, most of the defects can be accounted for by only a few categories. Suppose that the following information on structural defects in automobile doors is obtained: dents, 4; pits, 4; parts assembled out of sequence, 6; parts under trimmed, 21; missing holes/slots, 8; parts not lubricated, 5; parts out of contour, 30; and parts not deburred, 3.Construct and interpret a Pareto chart.

Answers: 3


Other questions on the subject: Mathematics
Mathematics, 21.06.2019 14:00, Leggett3146
Me. drysdale earned 906.25 in interest in one year on money that he had deposited in his local bank if the bank paid an interest rate of 6.25% how much money did mr. drysdale deposit
Answers: 2
Mathematics, 21.06.2019 16:30, SKYBLUE1015
Which elements in the set below are integers? 12, –3⁄4,√ 25 , –7, √ 5 , 14⁄7, 9 a. 12, √ 25 , –7, 9 b. 12, √ 25 , –7, 14⁄7, 9 c. –3⁄4, 25 , √ 5 ,14⁄7 d. 12, –7, 9
Answers: 2
Mathematics, 21.06.2019 17:40, samvgesite
Divide. reduce the answer to lowest terms.5 2/3 ÷ 3 1/9
Answers: 3
You know the right answer?
An important variation of a histogram for categorical data is the Pareto chart. This chart is widely...
Questions in other subjects:

Chemistry, 16.07.2019 10:30

History, 16.07.2019 10:30

Health, 16.07.2019 10:30

English, 16.07.2019 10:30
Health, 16.07.2019 10:30


