
Mathematics, 11.10.2020 01:01 brownkat002
Question 9 (Essay Worth 10 points) (04.01, 04.02 HC) Max practices the piano and the guitar for a total of 150 minutes every day. He practices the guitar for 80 minutes longer than he practices the piano. Part A: Write a pair of linear equations to show the relationship between the number of minutes Max practices the guitar (x) and the number of minutes he practices the piano V) every day. (5 points) Part B: How much time does Max spend practicing the piano every day? Show your work. (3 points) Part C: Is it possible for Max to have spent 125 minutes practicing the guitar if he practices for a total of exactly 150 minutes and practices the guitar for 80 minutes longer than he practices the piano? Explain your reasoning. (2 points) 123 Source B T U = x x Shes w Normal Part A y = x + 80 ous Question Question 1 (Answered)

Answers: 2


Other questions on the subject: Mathematics
Mathematics, 21.06.2019 16:00, kell22wolf
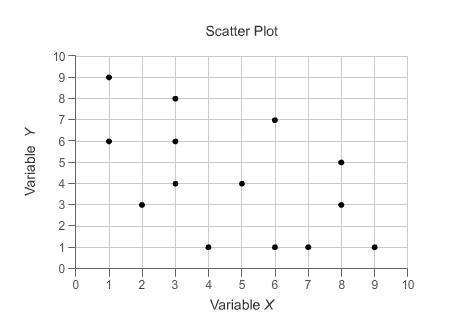
Part one: measurements 1. measure your own height and arm span (from finger-tip to finger-tip) in inches. you will likely need some from a parent, guardian, or sibling to get accurate measurements. record your measurements on the "data record" document. use the "data record" to you complete part two of this project. name relationship to student x height in inches y arm span in inches archie dad 72 72 ginelle mom 65 66 sarah sister 64 65 meleah sister 66 3/4 67 rachel sister 53 1/2 53 emily auntie 66 1/2 66 hannah myself 66 1/2 69 part two: representation of data with plots 1. using graphing software of your choice, create a scatter plot of your data. predict the line of best fit, and sketch it on your graph. part three: the line of best fit include your scatter plot and the answers to the following questions in your word processing document 1. 1. which variable did you plot on the x-axis, and which variable did you plot on the y-axis? explain why you assigned the variables in that way. 2. write the equation of the line of best fit using the slope-intercept formula $y = mx + b$. show all your work, including the points used to determine the slope and how the equation was determined. 3. what does the slope of the line represent within the context of your graph? what does the y-intercept represent? 5. use the line of best fit to you to describe the data correlation.
Answers: 2
Mathematics, 22.06.2019 02:00, fespinoza019
The null and alternate hypotheses are: h0: μ1 ≤ μ2 h1: μ1 > μ2 a random sample of 22 items from the first population showed a mean of 113 and a standard deviation of 12. a sample of 16 items for the second population showed a mean of 99 and a standard deviation of 6. use the 0.01 significant level. find the degrees of freedom for unequal variance test. (round down your answer to the nearest whole number.) state the decision rule for 0.010 significance level. (round your answer to 3 decimal places.) compute the value of the test statistic. (round your answer to 3 decimal places.) what is your decision regarding the null hypothesis? use the 0.01 significance level.
Answers: 1
You know the right answer?
Question 9 (Essay Worth 10 points) (04.01, 04.02 HC) Max practices the piano and the guitar for a to...
Questions in other subjects:

History, 10.10.2021 19:50


Spanish, 10.10.2021 19:50
Mathematics, 10.10.2021 20:00


Computers and Technology, 10.10.2021 20:00
Mathematics, 10.10.2021 20:00
Computers and Technology, 10.10.2021 20:00


