
Mathematics, 10.10.2020 19:01 noeminm105
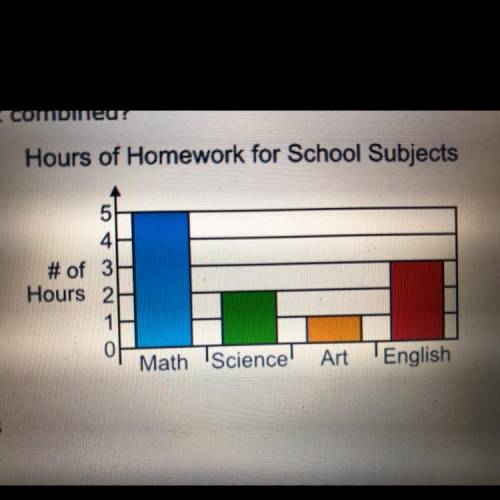
Kendra made a bar graph showing the number of hours she
spent doing homework for different school subjects last month.
How many hours did she spend doing math and science
homework combined?

Answers: 1


Other questions on the subject: Mathematics
Mathematics, 22.06.2019 00:30, lolagrace06
Me i’m stuck on all these questions besides the two bottom ones
Answers: 2
Mathematics, 22.06.2019 03:00, Samanthas6365
12 3 4 5 6 7 8 9 10 time remaining 42: 01 ryan gathered data about the age of the different dogs in his neighborhood and the length of their tails. which best describes the strength of the correlation, and what is true about the causation between the variables?
Answers: 2
Mathematics, 22.06.2019 10:30, ilovecatsomuchlolol
Terry runs a snowplowing business. income from snowplowing is giving by the function. f(x)35.5x+6 where f(x) is the income in dollars and x is the snowfall in inches received during a winter. if during the years 2006 to 2011,terrys town received 53,42,55,63,58 and 47 inches of snowfall. what was his income (in dollars) during those years
Answers: 3
Mathematics, 22.06.2019 11:00, shirleyyxo
When it comes to equity, what does it mean to have negative equity or be under water?
Answers: 3
You know the right answer?
Kendra made a bar graph showing the number of hours she
spent doing homework for different school s...
Questions in other subjects:


Biology, 08.12.2019 17:31

Mathematics, 08.12.2019 17:31


History, 08.12.2019 17:31


