
Mathematics, 10.10.2020 14:01 Theresab2021
20 POINTSSS
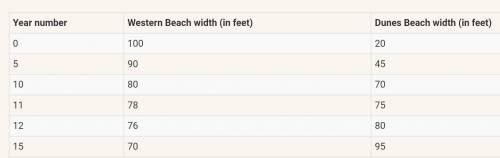
Two ocean beaches are being affected by erosion. The table shows the width, in feet, of each beach measured at high tide where 1995 is represented by year 0:
(Look at the picture)
Describe the patterns shown by the erosion data measurements shown for each of the beaches in the table.
Between which years will the beaches have approximately the same width?
Assuming these rates remain constant, what can you do to get a better approximation of when the two beaches will have the same width?

Answers: 1


Other questions on the subject: Mathematics
Mathematics, 21.06.2019 15:30, dessssimartinez6780
Name these type of angles shown check all that applies
Answers: 2
Mathematics, 21.06.2019 18:00, tmrsavage02p7cj16
Ageologist had two rocks on a scale that weighed 4.6 kilograms together. rock a was 0.5 of the total weight. how much did rock a weigh?
Answers: 1
Mathematics, 22.06.2019 00:00, boxergirl2062
Two consecutive negative integers have a product of 30. what are the integers?
Answers: 2
You know the right answer?
20 POINTSSS
Two ocean beaches are being affected by erosion. The table shows the width, in feet, of...
Questions in other subjects:


History, 31.01.2020 23:59

Spanish, 31.01.2020 23:59


Physics, 31.01.2020 23:59


