
Mathematics, 07.10.2020 14:01 kyrabrown33
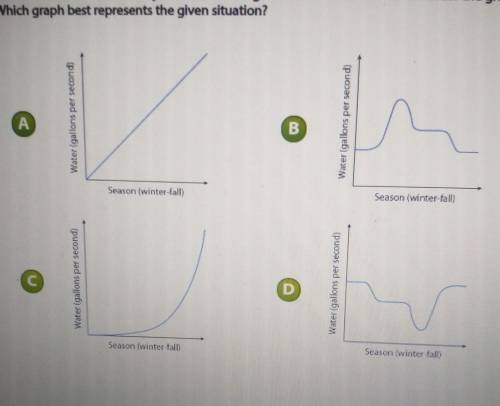
During the winter, the amount of water that flows down a river remains at a low constant. In the spring, when the snow melts, the amount of water increases drastically, until it decreases to a steady rate in the summer. The flow then slowly decreases through the fall into the winter. Consider the graphs shown. Which graph best represents the given situation?

Answers: 1


Other questions on the subject: Mathematics
Mathematics, 21.06.2019 14:00, kenziepickup
Roger and natalie travel in similar cars. roger's car drives the two miles to school in 7.5 minutes. natalie drives the same distance in the opposite direction but in only 6.5 minutes. what is true of their velocities?
Answers: 1
Mathematics, 21.06.2019 19:30, MariaIZweird7578
Combine the information in the problem and the chart using the average balance method to solve the problem.
Answers: 2
You know the right answer?
During the winter, the amount of water that flows down a river remains at a low constant. In the spr...
Questions in other subjects:

History, 30.01.2020 19:47


English, 30.01.2020 19:47

Physics, 30.01.2020 19:47
Mathematics, 30.01.2020 19:47


Spanish, 30.01.2020 19:47


