
Mathematics, 07.10.2020 14:01 inucornspineapple
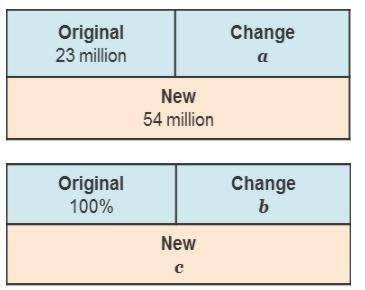
2 diagrams. In the first diagram, Original 23 million and Change a are the top 2 boxes. The bottom box contains New 54 million. In the second diagram, Original 100 percent and Change b are in the top 2 boxes. The bottom box contains New c.
The population of one country changed from 23 million to 54 million. Use the information to find the unknown values in the bar diagrams.
a =
31
23
≈ 1.347
b ≈
c ≈

Answers: 2


Other questions on the subject: Mathematics
Mathematics, 22.06.2019 01:00, allysongonzalezlove0
Ineed to know how to write question one in mathematical terms
Answers: 1
Mathematics, 22.06.2019 07:00, genyjoannerubiera
For questions 1–3, use the differential equation given by dx equals x times y divided by 3, y > 0.
Answers: 1
You know the right answer?
2 diagrams. In the first diagram, Original 23 million and Change a are the top 2 boxes. The bottom b...
Questions in other subjects:

Mathematics, 26.03.2021 21:00

Mathematics, 26.03.2021 21:00

Biology, 26.03.2021 21:00
Mathematics, 26.03.2021 21:00

Computers and Technology, 26.03.2021 21:00
Mathematics, 26.03.2021 21:00
Mathematics, 26.03.2021 21:00


