
Mathematics, 06.10.2020 14:01 andrwisawesome0
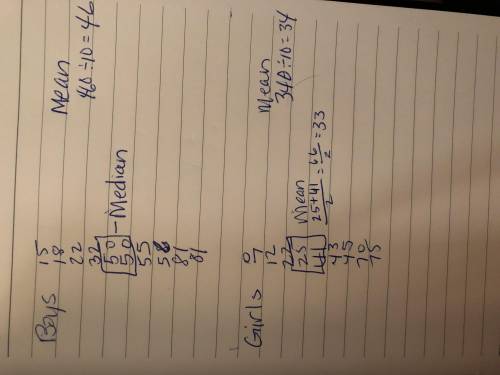
Sixth-grade students completed a random survey to determine how many songs each
student has downloaded to his/her media player in the past two months. The data
gathered is represented in the table below.
Music Downloads by Sixth Graders
Respondent
Number
1
2
3
4
5
6
7
8
9
10
Girls
50
32
15
56
81
50
18
81
22
55
Boys
75
41
25
22
7
0
43
12
45
70
a) Compute the measures of center for both the boys and girls data. Describe their
differences. Use the terms mean and median to justify your answer. 3 points)

Answers: 1


Other questions on the subject: Mathematics
Mathematics, 21.06.2019 18:20, genyjoannerubiera
17. a researcher measures three variables, x, y, and z for each individual in a sample of n = 20. the pearson correlations for this sample are rxy = 0.6, rxz = 0.4, and ryz = 0.7. a. find the partial correlation between x and y, holding z constant. b. find the partial correlation between x and z, holding y constant. (hint: simply switch the labels for the variables y and z to correspond with the labels in the equation.) gravetter, frederick j. statistics for the behavioral sciences (p. 526). cengage learning. kindle edition.
Answers: 2
Mathematics, 21.06.2019 21:00, hongkongbrat6840
What is the length and width of a 84.5 square foot rug? will mark
Answers: 1
Mathematics, 22.06.2019 00:00, genyjoannerubiera
Iwill arward ! , i if bt ≅ eu , bu ≅ et , prove: ∠b ≅ ∠e. fill in the blanks: draw segment ut ≅ bt≅ bu ≅ △ubt ≅ △
Answers: 1
You know the right answer?
Sixth-grade students completed a random survey to determine how many songs each
student has downloa...
Questions in other subjects:
Mathematics, 20.04.2021 20:40


Social Studies, 20.04.2021 20:40

Mathematics, 20.04.2021 20:40

Mathematics, 20.04.2021 20:40
Mathematics, 20.04.2021 20:40
Mathematics, 20.04.2021 20:40


