
Mathematics, 06.10.2020 14:01 hungtistic
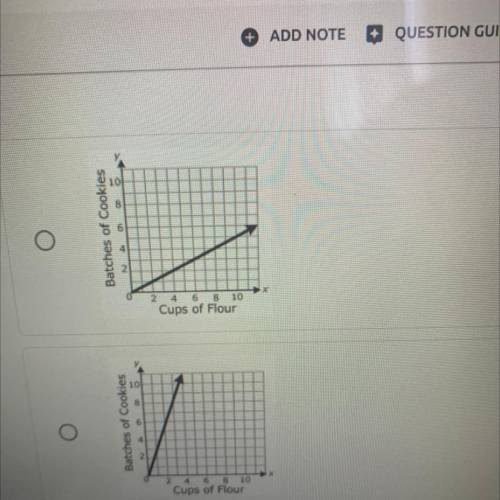
A certain cookie recipe calls for 2 cups of flour to make one batch of
cookies. Which graph best represents the relationship between the amount
of flour and the number of batches of cookies that can be made using this
recipe?

Answers: 2


Other questions on the subject: Mathematics
Mathematics, 21.06.2019 19:30, daquanmcqueen77
Are triangles the congruent? write the congruency statement. what is the congruency that proves they are congruent? what is the perimeter of ∆pqr?
Answers: 1
Mathematics, 22.06.2019 00:00, mattiemattoos
One of the complementary angles is 4 degrees mor than the other. find the angles (recall that complementary angles are angles whose sum is 90 degrees.) which of the following can not be used to solve the problem if x represents one of the angles? a. 2x-4=90 b. 2x+4=90 c. x+4=90
Answers: 1
You know the right answer?
A certain cookie recipe calls for 2 cups of flour to make one batch of
cookies. Which graph best re...
Questions in other subjects:

Mathematics, 15.04.2020 04:52


Biology, 15.04.2020 04:52


Mathematics, 15.04.2020 04:52


