Which graph represents the compound inequality?
h> -5 and h < 2
...

Mathematics, 02.10.2020 23:01 dimpleschris101
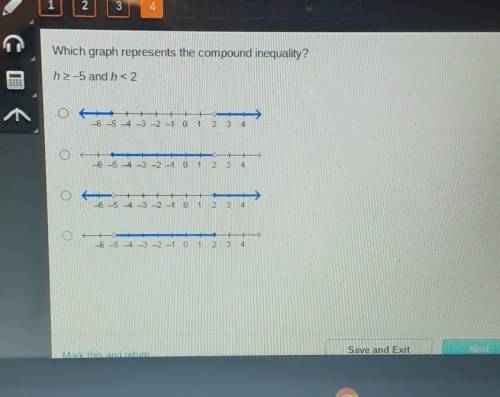
Which graph represents the compound inequality?
h> -5 and h < 2

Answers: 2


Other questions on the subject: Mathematics
Mathematics, 20.06.2019 18:04, yaxcalandreya
Abus ride for a senior citizen cost $1.25. a monthly pass costs $35. write and inequality that represents the number of times a senior citizen must ride the bus for the monthly pass to be a better deal.
Answers: 1
Mathematics, 21.06.2019 18:00, phillipsk5480
Express in the simplest form: (x^2+9x+14/x^2-49) / (3x+6/x^2+x-56)
Answers: 3
You know the right answer?
Questions in other subjects:
Mathematics, 22.03.2021 17:40

History, 22.03.2021 17:40


Mathematics, 22.03.2021 17:40

English, 22.03.2021 17:40

Social Studies, 22.03.2021 17:40


