
Mathematics, 29.09.2020 04:01 gigglegirl5802
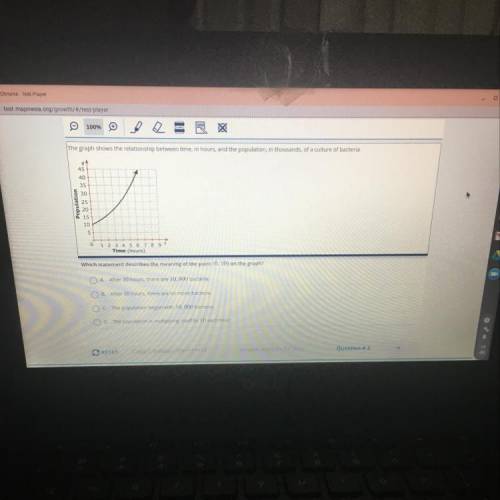
The graph shows the relationship between time, in hours, and the population, in thousands of a culture of bacteria.
+
45
40
35
30
Population
25
20
15
10
5
0 1 2 3 4 5 6 7 8
Time (hours)
which statement describes the meaning of the point (010) on the graph?
A After 10 hours there are 10.000 bacteria.
B. After 10 hours there are no more bacteria
C The population began with 10,000 bacteria
D. The population is multiplying itself by 10 each hour

Answers: 3


Other questions on the subject: Mathematics
Mathematics, 21.06.2019 12:30, jc95704816
The slope of a line is –2 and its y-intercept is (0, 3). what is the equation of the line that is parallel to the first line and passes through (2, 2)? a. 2x + y = 6 b. y = –2x + 3 c. y=1/2x +6 d. y=-2x-6
Answers: 1
Mathematics, 21.06.2019 13:30, kaylatunell123
Lindsay is creating a bridge out of dried pasta and glue. in her plans, she sketches the graph to determine the lengths of the noodles, in centimeters, needed for the arch to increase the length of the bridge in 1 centimeter increments. which function did lindsay use to create her design? f(x) = (x – 5)2 + 8 f(x) = –(x + 5)2 + 8 f(x) = 0.5(x + 5)2 + 8 f(x) = –0.5(x – 5)2 + 8
Answers: 1
Mathematics, 21.06.2019 18:30, rheamskeorsey33
Acoin bank containing only dimes and quarters has 12 more dimes than quarters. the total value of the coins is $11. how many quarters and dimes are in the coin bank?
Answers: 1
You know the right answer?
The graph shows the relationship between time, in hours, and the population, in thousands of a cultu...
Questions in other subjects:

Mathematics, 29.01.2021 20:40
Mathematics, 29.01.2021 20:40


World Languages, 29.01.2021 20:40

Mathematics, 29.01.2021 20:40
Mathematics, 29.01.2021 20:40


