The following parallel dotplots
show the total family income of randomly chosen
individuals f...

Mathematics, 27.09.2020 09:01 anher
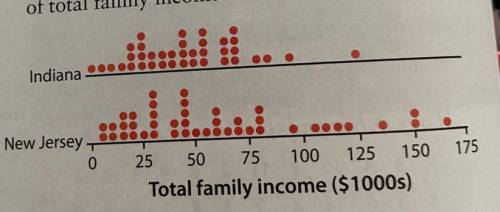
The following parallel dotplots
show the total family income of randomly chosen
individuals from Indiana (38 individuals) and New
Jersey (44 individuals). Compare the distributions
of total family incomes in these two samples.

Answers: 2


Other questions on the subject: Mathematics
Mathematics, 22.06.2019 01:30, babbybronx
When you find the area of a triangle do you use in. or in2
Answers: 2
Mathematics, 22.06.2019 04:40, kikiwaka1
Complete the frequency table: method of travel to school walk/bike bus car row totals under age 15 60 165 age 15 and above 65 195 column totals 152 110 98 360 what percentage of students under age 15 travel to school by car? round to the nearest whole percent.
Answers: 2
You know the right answer?
Questions in other subjects:

Social Studies, 29.08.2019 00:00

History, 29.08.2019 00:00


