
Mathematics, 27.09.2020 04:01 sleepyflower10
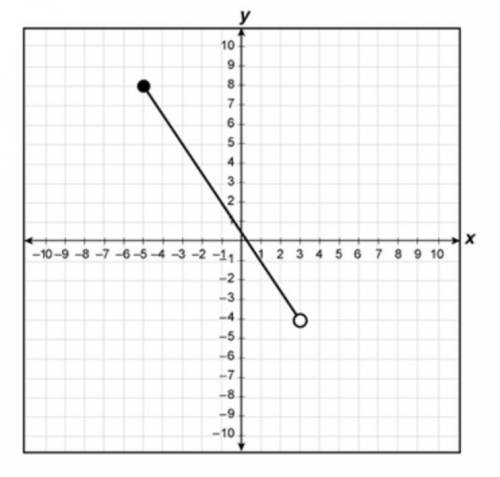
The graph of part of linear function h is shown on the grid.
Which inequality best represents the domain of the part shown?
−5≤x<3
−5
−4
−4≤h(x)<8

Answers: 2


Other questions on the subject: Mathematics
Mathematics, 21.06.2019 19:30, AriesTwice
Acollection of coins has value of 64 cents. there are two more nickels than dimes and three times as many pennies as dimes in this collection. how many of each kind of coin are in the collection?
Answers: 1
You know the right answer?
The graph of part of linear function h is shown on the grid.
Which inequality best represents the d...
Questions in other subjects:


History, 02.02.2020 19:00

English, 02.02.2020 19:00

Social Studies, 02.02.2020 19:00
Mathematics, 02.02.2020 19:00
Mathematics, 02.02.2020 19:00

Physics, 02.02.2020 19:00


