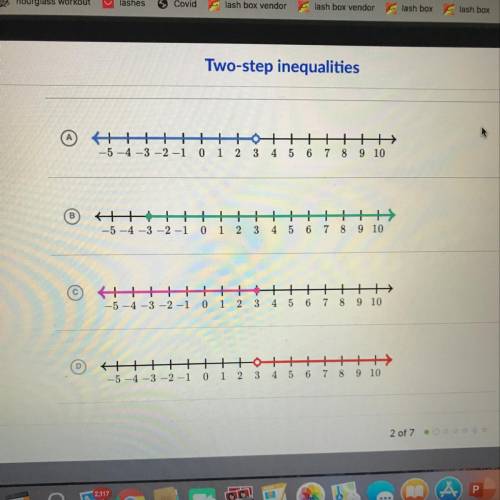
Which graph represents the solution set of this inequality?
-36 – 15 > -24
...

Mathematics, 25.09.2020 02:01 Auriieee
Which graph represents the solution set of this inequality?
-36 – 15 > -24

Answers: 2


Other questions on the subject: Mathematics
Mathematics, 21.06.2019 18:00, cici170
Each month, a shopkeeper spends 5x + 14 dollars on rent and electricity. if he spends 3x−5 dollars on rent, how much does he spend on electricity? for which value(s) of x is the amount the shopkeeper spends on electricity less than $100? explain how you found the value(s).
Answers: 2
Mathematics, 21.06.2019 18:10, normahernandez977
Find the solution set of this inequality. enter your answer in interval notation using grouping symbols. |8x-4| ≤ 12
Answers: 1
You know the right answer?
Questions in other subjects:

Mathematics, 12.06.2021 14:00
English, 12.06.2021 14:00
Mathematics, 12.06.2021 14:00


