
Mathematics, 23.09.2020 04:01 diazsindy
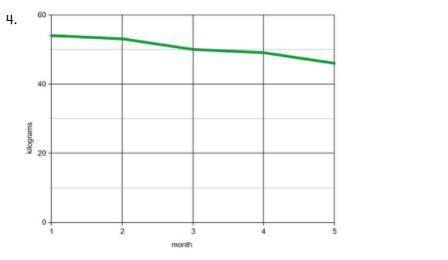
The graph above shows Jack's mass over a five-month period. Based on the trend in the data, what do you predict will happen to Jack's mass the subsequent month?
A. Jack's mass will increase.
B. Jack's mass will decrease.
C. It is important to predict because there is no trend in Jack's mass.
D. The next month's data will be Anomalous.

Answers: 1


Other questions on the subject: Mathematics
Mathematics, 21.06.2019 15:30, squawk1738
Given the box plot, will the mean or the median provide a better description of the center? box plot with min at 10.5, q1 at 11.5, median at 12.5, q3 at 13.5, max at 15
Answers: 2
Mathematics, 21.06.2019 22:00, reesewaggoner8
Uestion 1(multiple choice worth 5 points) (05.02)alex wants to paint one side of his skateboard ramp with glow-in-the-dark paint, but he needs to know how much area he is painting. calculate the area of the isosceles trapezoid. isosceles trapezoid with top base 12 feet, bottom base of 18 feet, and height of 6 feet. 72 ft2 84 ft2 90 ft2 108 ft2
Answers: 1
You know the right answer?
The graph above shows Jack's mass over a five-month period. Based on the trend in the data, what do...
Questions in other subjects:


Biology, 20.03.2020 20:43
History, 20.03.2020 20:43
Mathematics, 20.03.2020 20:43
Mathematics, 20.03.2020 20:43
Mathematics, 20.03.2020 20:43


