True or False
Pie graphs should have a title and display percentages totaling 100%...

Mathematics, 22.09.2020 04:01 ekarlewicz3343
True or False
Pie graphs should have a title and display percentages totaling 100%

Answers: 2


Other questions on the subject: Mathematics
Mathematics, 21.06.2019 18:40, stephen4438
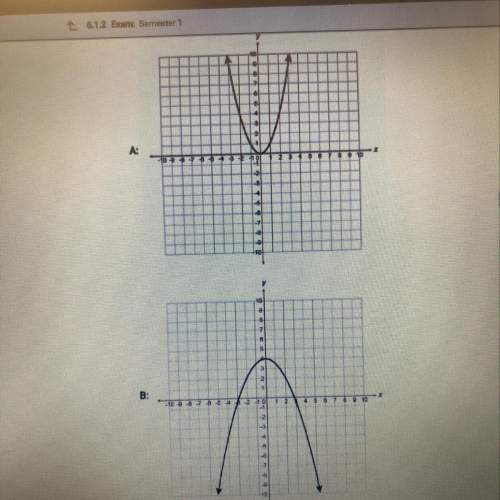
Which of the following represents the range of the graph of f(x) below
Answers: 1
Mathematics, 21.06.2019 19:40, nancy00
Aretha wanted to gather data about the cost of local bowling leagues in her area. she plotted the data and determined that the average bowling league costs consist of a one-time registration fee and a monthly fee modeled by the equation y = 15x + 20. identify and interpret the y-intercept in this model. the y-intercept is 20. this is the cost per month. the y-intercept is 20. this is the cost of registration. the y-intercept is 15. this is the cost of registration. the y-intercept is 15. this is the cost per month.
Answers: 1
Mathematics, 22.06.2019 00:40, Hjackson24
What is the interquartile range (iqr) of the data set represented by this box plot?
Answers: 3
You know the right answer?
Questions in other subjects:


Health, 17.09.2021 14:40
Mathematics, 17.09.2021 14:40
Mathematics, 17.09.2021 14:40
Mathematics, 17.09.2021 14:40
Mathematics, 17.09.2021 14:40

Spanish, 17.09.2021 14:40

English, 17.09.2021 14:40


