
Mathematics, 20.09.2020 23:01 ggdvj9gggsc
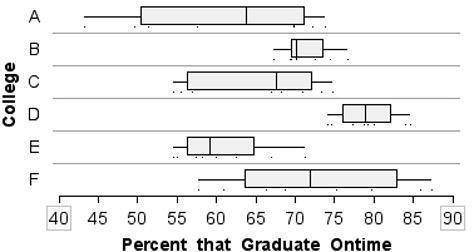
The data graphed below is 8 years of data from six colleges. The variable is the percent of freshmen that graduate on-time. a) Which college had the highest on-time graduation rate during the years of this study? How do you know? b) On average, which college had the highest on-time graduation rate? How do you know? c) Which college had the most consistent on-time graduation rates overall? Write a sentence precisely describing the variability for this college. d) Which college had the smallest amount of variability relative to its median? Write a sentence precisely describing the variability for this college.

Answers: 1


Other questions on the subject: Mathematics
Mathematics, 21.06.2019 13:00, thisbegaby
Jessica is a custodian at oracle arena. she waxes 20 m2 of the floor in 3/5 of an hour. jessica waxes the floor at a constant rate. at this rate how many sqaures meters can she wax per hour
Answers: 3
You know the right answer?
The data graphed below is 8 years of data from six colleges. The variable is the percent of freshmen...
Questions in other subjects:
Mathematics, 21.05.2020 19:07


Biology, 21.05.2020 19:07

Mathematics, 21.05.2020 19:07

Mathematics, 21.05.2020 19:07
Mathematics, 21.05.2020 19:07


