
Mathematics, 20.09.2020 18:01 Gracebrown6990
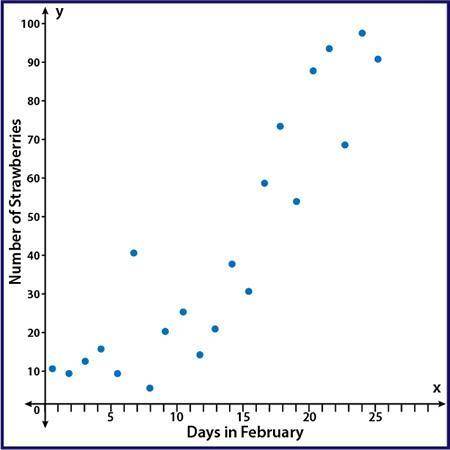
The scatter plot shows the number of strawberries that have been picked on the farm during the month of February: A scatter plot with points showing an upward trend with points that are moderately spread out from a line of best fit. The y-axis is labeled Number of Strawberries and the x-axis is labeled Days in February Part A: Using computer software, a correlation coefficient of r = 0.01 was calculated. Based on the scatter plot, is that an accurate value for this data? Why or why not? (5 points) Part B: Instead of comparing the number of strawberries picked and the day in February write a scenario that would be a causal relationship for strawberries picked on the farm. (5 points)

Answers: 1


Other questions on the subject: Mathematics
Mathematics, 21.06.2019 13:00, Victoriag2626
The actual length of side t is 0.045 cm. use the scale drawing to find the actual side length of w. a) 0.06 cm b) 0.075 cm c) 0.45 cm d) 0.75 cm
Answers: 3
Mathematics, 21.06.2019 20:30, cheating53
Kayaks rent for $35 per day. which expression can you use to find the cost in dollars of renting 3 kayaks for a day?
Answers: 1
You know the right answer?
The scatter plot shows the number of strawberries that have been picked on the farm during the month...
Questions in other subjects:
Mathematics, 24.03.2021 01:20

English, 24.03.2021 01:20
Mathematics, 24.03.2021 01:20

Physics, 24.03.2021 01:20
English, 24.03.2021 01:20


Mathematics, 24.03.2021 01:20


