What is happening to this graph when the x-values are between 4 and 8?
y
10
5
-1...

Mathematics, 20.09.2020 17:01 felipa11
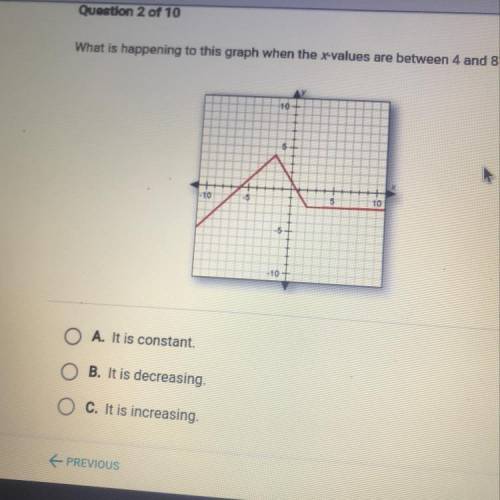
What is happening to this graph when the x-values are between 4 and 8?
y
10
5
-10
5
5
10
-5
10

Answers: 1


Other questions on the subject: Mathematics
Mathematics, 21.06.2019 16:30, inucornspineapple
Arandom sample of 150 high school students were asked whether they have a job. the results are shown in the table. have a job do not have a job male 48 35 female 41 26 select a ord or phrase from the drop-down menus to correctly complete the statements describing the association.
Answers: 1
Mathematics, 21.06.2019 17:00, riley01weaver1
Segment xy is dilated through point m with a scale factor of 2. which segment shows the correct result of the dilation
Answers: 1
You know the right answer?
Questions in other subjects:

Biology, 19.03.2021 06:10


Mathematics, 19.03.2021 06:10
Mathematics, 19.03.2021 06:10
Social Studies, 19.03.2021 06:10
Biology, 19.03.2021 06:10


