
Mathematics, 20.09.2020 03:01 desireeandrada9
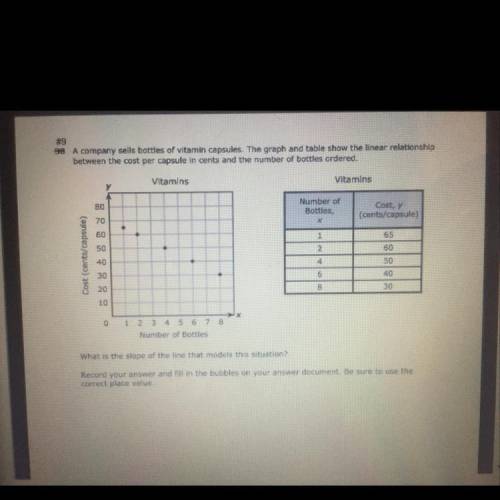
A company sells bottles of vitamin capsules. The graph and table show the linear relationship
between the cost per capsule in cents and the number of bottles ordered.
Vitamins
Vitamins
80
Number of
Bottles,
Cost, y
(cents/capsule)
65
50
60
Cost (cents/capsule)
40
4
30
6
020
0
1
2
Number of Botties
What is the slope of the line that models this situation?

Answers: 2


Other questions on the subject: Mathematics
Mathematics, 21.06.2019 22:30, 19thomasar
Atotal of 766 tickets were sold for the school play. they were either adult tickets or student tickets. there were 66 more student tickets sold than adult tickets. how many adult tickets were sold?
Answers: 1
Mathematics, 22.06.2019 00:50, shelbylynn17
The students in a class were asked how many siblings they have. the data obtained is represented in the dot plot. the number of students who have no siblings is . the number of students who have three or more siblings is .
Answers: 1
You know the right answer?
A company sells bottles of vitamin capsules. The graph and table show the linear relationship
betwe...
Questions in other subjects:
Mathematics, 12.12.2019 17:31

Biology, 12.12.2019 17:31

History, 12.12.2019 17:31
Mathematics, 12.12.2019 17:31
Biology, 12.12.2019 17:31

Computers and Technology, 12.12.2019 17:31


