
Mathematics, 20.09.2020 02:01 avagracesmith5
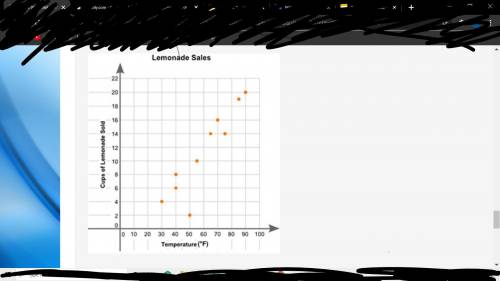
06.02)Eric plotted the graph below to show the relationship between the temperature of his city and the number of cups of lemonade he sold daily: A scatter plot is shown with the title Lemonade Sales. The x-axis is labeled High Temperature, and the y-axis is labeled Cups of Lemonade Sold. Data points are located at 30 and 4, 40 and 6, 40 and 8, 50 and 2, 55 and 10, 65 and 14, 70 and 16, 75 and 14, 85 and 19, 90 and 20. Part A: Describe the relationship between the temperature of the city and the number of cups of lemonade sold. (2 points) Part B: Describe how you can make the line of best fit. Write the approximate slope and y-intercept of the line of best fit. Show your work, including the points that you use to calculate the slope and y-intercept. (3 points)

Answers: 2


Other questions on the subject: Mathematics
Mathematics, 21.06.2019 16:00, lidsrays
Select the correct answer. joshua likes to read. he read 6 books when he was 6 years old. every year he doubled the number of books he read the previous year. how many total books did he read between the ages of 6 and 10? a. 60 b. 90 c.186 d.187
Answers: 1
Mathematics, 21.06.2019 17:30, CarlosCooke2
You can find the constant of proportionality by finding the ratio of
Answers: 1
You know the right answer?
06.02)Eric plotted the graph below to show the relationship between the temperature of his city and...
Questions in other subjects:

History, 03.08.2019 08:40


Biology, 03.08.2019 08:40
English, 03.08.2019 08:40

Computers and Technology, 03.08.2019 08:40
Computers and Technology, 03.08.2019 08:40

Business, 03.08.2019 08:40
History, 03.08.2019 08:40
History, 03.08.2019 08:40


