
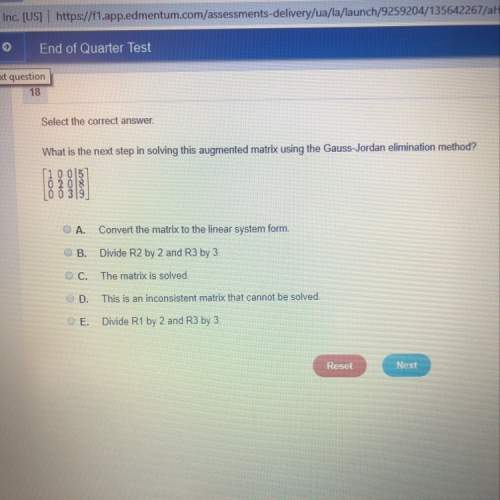
Mathematics, 20.09.2020 18:01 deduran
A scientist collected two sample sets of snowfall data. Which statistic should he use to compare the spread of the two
sets of data?
3
O median
O mode
mean
• skandard deviation

Answers: 3


Other questions on the subject: Mathematics
Mathematics, 21.06.2019 22:50, zitterkoph
Listed below are time intervals (min) between eruptions of a geyser. assume that the "recent" times are within the past few years, the "past" times are from around 20 years ago, and that the two samples are independent simple random samples selected from normally distributed populations. do not assume that the population standard deviations are equal. does it appear that the mean time interval has changed? is the conclusion affected by whether the significance level is 0.10 or 0.01? recent 78 90 90 79 57 101 62 87 71 87 81 84 57 80 74 103 62 past 88 89 93 94 65 85 85 92 87 91 89 91 follow the steps of hypothesis testing, including identifying the alternative and null hypothesis, calculating the test statistic, finding the p-value, and making a conclusions about the null hypothesis and a final conclusion that addresses the original claim. use a significance level of 0.10. is the conclusion affected by whether the significance level is 0.10 or 0.01? answer choices below: a) yes, the conclusion is affected by the significance level because h0 is rejected when the significance level is 0.01 but is not rejected when the significance level is 0.10. b) no, the conclusion is not affected by the significance level because h0 is not rejected regardless of whether a significance level of 0.10 or 0.01 is used. c) yes, the conclusion is affected by the significance level because h0 is rejected when the significance level is 0.10 but is not rejected when the significance level is 0.01. d) no, the conclusion is not affected by the significance level because h0 is rejected regardless of whether a significance level of 0.10 or 0.01 is used.
Answers: 3
Mathematics, 22.06.2019 02:30, issagershome
Will’s boss has asked him to compile the credit scores of everyone in his department. the data that will collected is shown in the table below. what is the mode of the credit scores in will’s department? (round to the nearest whole point, if applicable.) 634 667 644 892 627 821 857 703 654 a. 667 b. 722 c. 627 d. there is no mode in this group.
Answers: 1
Mathematics, 22.06.2019 03:00, bentleyking1k
More than 450450 students traveled to a state park for a field trip. the school allowed 66 students to travel by car, and the rest traveled on 1111 buses, each of which held the same number of students. if there were ss students in each bus, which inequality best represents this situation?
Answers: 1
You know the right answer?
A scientist collected two sample sets of snowfall data. Which statistic should he use to compare the...
Questions in other subjects:


History, 30.03.2020 22:12

Mathematics, 30.03.2020 22:13
Physics, 30.03.2020 22:13
Mathematics, 30.03.2020 22:13


