
Mathematics, 19.09.2020 01:01 donttrip10
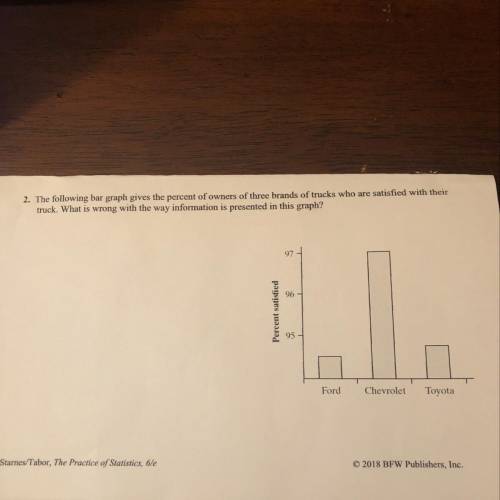
2. The following bar graph gives the percent of owners of three brands of trucks who are satisfied with their truck. What is wrong with the way information is presented in this graph?

Answers: 2


Other questions on the subject: Mathematics
Mathematics, 21.06.2019 16:40, carson5238
Tcan be concluded that % of the seniors would prefer to see more candid pictures in this year's edition of the yearbook.
Answers: 1
Mathematics, 21.06.2019 20:00, aliahauyon20
The rectangle shown has a perimeter of 108 cm and the given area. its length is 6 more than five times its width. write and solve a system of equations to find the dimensions of the rectangle.
Answers: 3
You know the right answer?
2. The following bar graph gives the percent of owners of three brands of trucks who are satisfied w...
Questions in other subjects:

Social Studies, 03.12.2021 21:30
Social Studies, 03.12.2021 21:30

Mathematics, 03.12.2021 21:30

Computers and Technology, 03.12.2021 21:30


Social Studies, 03.12.2021 21:30


