
Mathematics, 08.09.2020 14:01 miwptv105own5u8
Test the claim below about the mean of the differences for a population of paired data at the level of significance α Assume the samples are random and dependent, and the populations are normally distributed Claim μ,-0: α-0.10. Sample statistics: d-3.5, sd-894, n-9 Identify the null and alternative hypotheses. Choose the correct answer below The test statistic is t (Round to two decimal places as needed) The critical value(s) is(are)- (Round to two decimal places as needed. Use a comma to separate answers as needed.) Since the test statistic isthe rejection region, the null hypothesis. There statistically significant evidence to reject the claim.

Answers: 1


 at a degree of freedom of 8 is
  is outside the rejection region , we fail to reject the null hypothesis ,There is no sufficient evidence to reject the claim
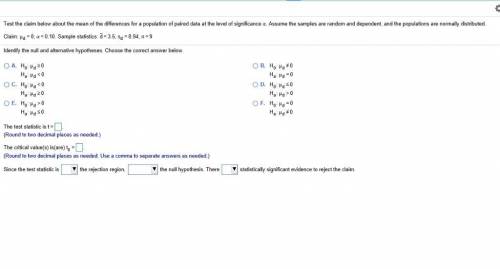


Other questions on the subject: Mathematics
Mathematics, 21.06.2019 17:00, deniseelyons15
Yosef can eat 21 jamuns while rose can eat just 15 . complete the blank. yosef can eat % more jamuns than rose.
Answers: 1
Mathematics, 21.06.2019 19:00, hbstanley3
You and a friend went to the movies. you spent half your money on tickets. then you spent 1/4 of the money on popcorn, $2 on candy, and $3 on a soda. if you have $1 left, hiw much money did u take to the movies?
Answers: 1
Mathematics, 22.06.2019 01:30, Laners0219
Which represents the number of times all outcomes less than a given outcome occur? cumulative frequency relative frequency frequency cumulative relative frequency
Answers: 3
You know the right answer?
Test the claim below about the mean of the differences for a population of paired data at the level...
Questions in other subjects:

Mathematics, 06.05.2021 05:20
Mathematics, 06.05.2021 05:20

Computers and Technology, 06.05.2021 05:20


Physics, 06.05.2021 05:20


Mathematics, 06.05.2021 05:20


