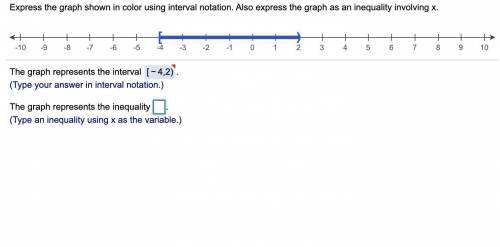
The graph represents the inequality?
...

Mathematics, 06.09.2020 22:01 taniyawalker123
The graph represents the inequality?

Answers: 2


Other questions on the subject: Mathematics
Mathematics, 21.06.2019 16:50, Chartwig4831
For the equations below which statement is true ? -2x=14 6x=-42
Answers: 1
Mathematics, 21.06.2019 20:10, thekid3176
Which value of m will create a system of parallel lines with no solution? y= mx - 6 8x - 4y = 12
Answers: 1
Mathematics, 21.06.2019 21:50, bcox32314
Desmond wants to sell his car that he paid $8,000 for 2 years ago. the car depreciated, or decreased in value, at a constant rate each month over a 2-year period. if x represents the monthly depreciation amount, which expression shows how much desmond can sell his car for today? \ 8,000 + 24x 8,000 - 24x 8,000 + 2x 8,000 - 2x
Answers: 3
You know the right answer?
Questions in other subjects:


Business, 23.08.2021 17:10


