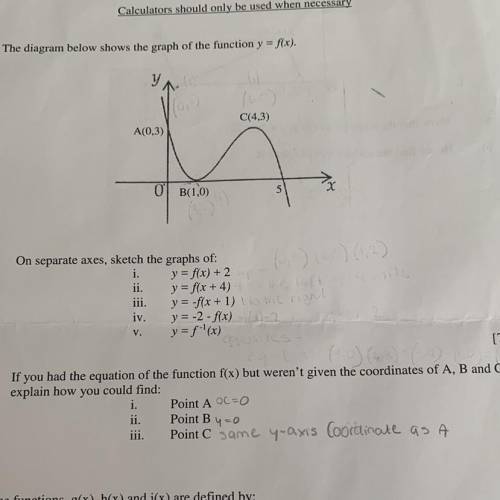
1. The diagram below shows the graph of the function y = f(x).
у
C(4,3)
A(0,3)
0<...

Mathematics, 07.09.2020 04:01 tomasgarrido10
1. The diagram below shows the graph of the function y = f(x).
у
C(4,3)
A(0,3)
0
B(1,0)
a)
V.
On separate axes, sketch the graphs of:
i. y = f(x) + 2
ii. y = f(x + 4)
iii. y = -f(x + 1)
iv. y = -2 -f(x)
y = f (x)
[7]
If you had the equation of the function f(x) but weren't given the coordinates of A, B and C,
explain how you could find:
i. Point A CO
ii.
Point C same yuaxis Coordinate as a
[3]
b)
Point By=0

Answers: 1


Other questions on the subject: Mathematics
Mathematics, 21.06.2019 13:00, zaylelangaigne2006
Giving 100 points asap bev has to cut her grandma's grass this weekend and wants to know exactly how much area she will be cutting. calculate the area of the polygon. be sure to show all your work and explain your answer.
Answers: 1
Mathematics, 21.06.2019 19:10, gurlnerd
1jessica's home town is a mid-sized city experiencing a decline in population. the following graph models the estimated population if the decline continues at the same rate. select the most appropriate unit for the measure of time that the graph represents. a. years b. hours c. days d. weeks
Answers: 2
Mathematics, 21.06.2019 20:30, officialgraciela67
William invested $5000 in an account that earns 3.8% interest, compounded annually. the formula for compound interest is a(t) = p(1 + i)t. how much did william have in the account after 6 years? (apex)
Answers: 2
Mathematics, 21.06.2019 22:00, LilFabeOMM5889
In δabc, m∠acb = 90°, cd ⊥ ab and m∠acd = 45°. find: a find cd, if bc = 3 in
Answers: 1
You know the right answer?
Questions in other subjects:


Chemistry, 28.01.2020 10:31

English, 28.01.2020 10:31


