
Mathematics, 06.09.2020 05:01 trvptrav
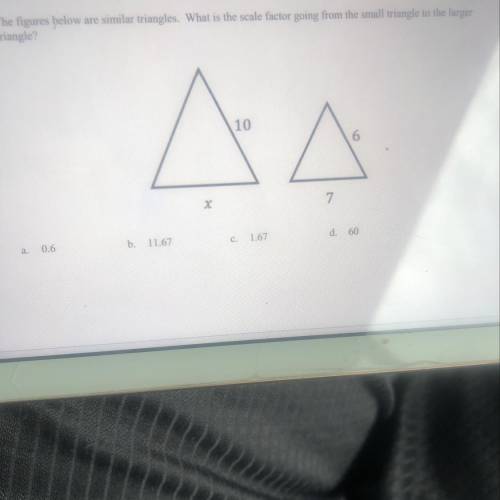
9. The figures below are similar triangles. What is the scale factor going from the small triangle to the larger
triangle?
10
A
X
7
c.
1.67
b. 11.67
d. 60
0.6
a.

Answers: 2


Other questions on the subject: Mathematics
Mathematics, 21.06.2019 22:30, Carlosanddana123
What is the approximate value of x in the equation below.–3.396–0.7080.3040.955
Answers: 1
Mathematics, 21.06.2019 22:50, sarbjit879
Which linear inequality is represented by the graph?
Answers: 1
Mathematics, 22.06.2019 01:30, reneebrown017
Use the given degree of confidence and sample data to construct a confidence interval for the population mean mu . assume that the population has a normal distribution. a laboratory tested twelve chicken eggs and found that the mean amount of cholesterol was 185 milligrams with sequals 17.6 milligrams. a confidence interval of 173.8 mgless than muless than 196.2 mg is constructed for the true mean cholesterol content of all such eggs. it was assumed that the population has a normal distribution. what confidence level does this interval represent?
Answers: 1
Mathematics, 22.06.2019 04:00, tony7135
Newtons second law says force(f) is equal to mass (m) times avceration (a) a scientist wamts to calculate the force of an objecy where the acceleration of gravity (g) is 9.8m/ s2 use the function to calculate the force of an object with a mass73( m) of 0.29 kilograms
Answers: 2
You know the right answer?
9. The figures below are similar triangles. What is the scale factor going from the small triangle t...
Questions in other subjects:

Mathematics, 02.12.2020 21:30
Mathematics, 02.12.2020 21:30

Health, 02.12.2020 21:30


Biology, 02.12.2020 21:30
Biology, 02.12.2020 21:30


