
Mathematics, 07.09.2020 02:01 kekoanabor19
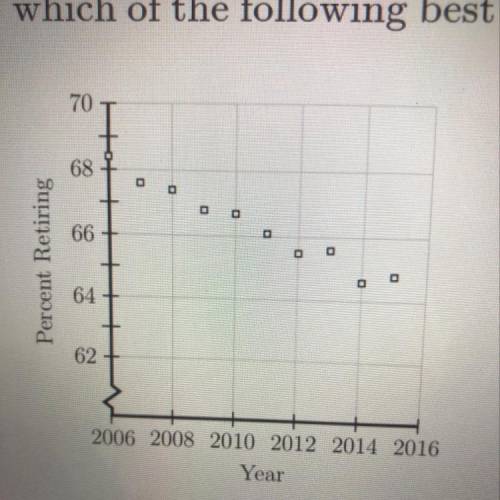
The scatterplot shown below represents data for each of the years from 2006
to 2015. The plot shows the percent of people 62 years of age and older who
were working and then retired during each of those years. If this trend continued.
which of the following best predicts the percent who retired in 2016 ?

Answers: 1


Other questions on the subject: Mathematics
Mathematics, 22.06.2019 02:30, chelsearodi3985
Astudent found the solution below for the given inequality. |x-9|< -4 x-9> 4 and x-9< -4 x> 13 and x< 5 which of the following explains whether the student is correct? -the student is completely correct because the student correctly wrote and solved the compound inequality. -the student is partially correct because only one part of the compound inequality is written correctly. -the student is partially correct because the student should have written the statements using “or” instead of “and.” -the student is completely incorrect because there is no solution to this inequality.
Answers: 2
Mathematics, 22.06.2019 03:20, lilkassrocks
Hilary decided to purchase 3 points in order to lower her interest rate on her $140,000 mortgage. how much additional money does she need to bring to closing? a. $4200 b. $4000 c. $6 d. $400
Answers: 1
You know the right answer?
The scatterplot shown below represents data for each of the years from 2006
to 2015. The plot shows...
Questions in other subjects:
Mathematics, 19.05.2021 04:30


English, 19.05.2021 04:30


Arts, 19.05.2021 04:30
Mathematics, 19.05.2021 04:30


