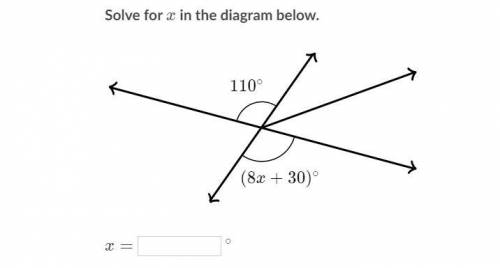
Solve for x in the diagram below
...

Mathematics, 04.09.2020 23:01 annabanana1298
Solve for x in the diagram below

Answers: 3


Other questions on the subject: Mathematics
Mathematics, 21.06.2019 16:00, SavyBreyer
Use the function f(x) is graphed below. the graph of the function to find, f(6). -2 -1 1 2
Answers: 1
Mathematics, 22.06.2019 01:30, malikbryant2002
At store a, erasers are sold individually. the cost y of x erasers is represented by the equation y=0.75x. the costs of erasers at store b are shown in the graph.
Answers: 2
Mathematics, 22.06.2019 01:30, jude40
Asample of 200 rom computer chips was selected on each of 30 consecutive days, and the number of nonconforming chips on each day was as follows: the data has been given so that it can be copied into r as a vector. non. conforming = c(10, 15, 21, 19, 34, 16, 5, 24, 8, 21, 32, 14, 14, 19, 18, 20, 12, 23, 10, 19, 20, 18, 13, 26, 33, 14, 12, 21, 12, 27) #construct a p chart by using the following code. you will need to enter your values for pbar, lcl and ucl. pbar = lcl = ucl = plot(non. conforming/200, ylim = c(0,.5)) abline(h = pbar, lty = 2) abline(h = lcl, lty = 3) abline(h = ucl, lty = 3)
Answers: 3
Mathematics, 22.06.2019 02:40, hgdthbgjnb83661
How many significant figures are there in the number 10.76?
Answers: 1
You know the right answer?
Questions in other subjects:

Mathematics, 21.11.2020 01:00


English, 21.11.2020 01:00


