
Mathematics, 04.09.2020 01:01 genyjoannerubiera
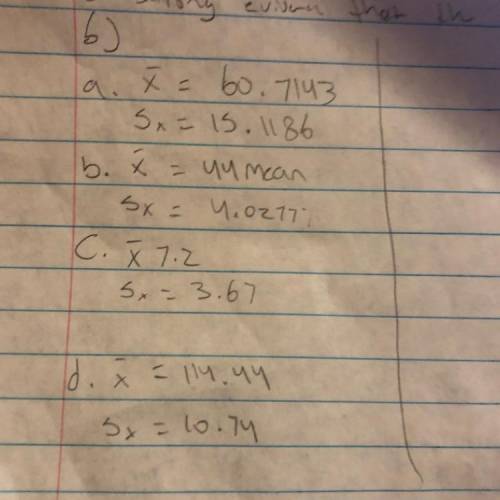
7. Now using your answers and the data sets from problem 6, calculate the standard error of the mean. 8. Now that you have found the standard error, Graph each data set using the error bars on the graph.

Answers: 1


Other questions on the subject: Mathematics
Mathematics, 20.06.2019 18:04, marshalldayton1452
Which expression shows the result of applying the distributive property to 9(2+5m) 11 + 14m 18 + 45m 18 + 5m 2 + 45m
Answers: 1
Mathematics, 21.06.2019 17:30, BreBreDoeCCx
If the class was going to get a class pet and 5 picked fish and 7 pick bird and 8 picked rabbits have many students were in the
Answers: 1
You know the right answer?
7. Now using your answers and the data sets from problem 6, calculate the standard error of the mean...
Questions in other subjects:


History, 15.07.2019 05:30

Mathematics, 15.07.2019 05:30


