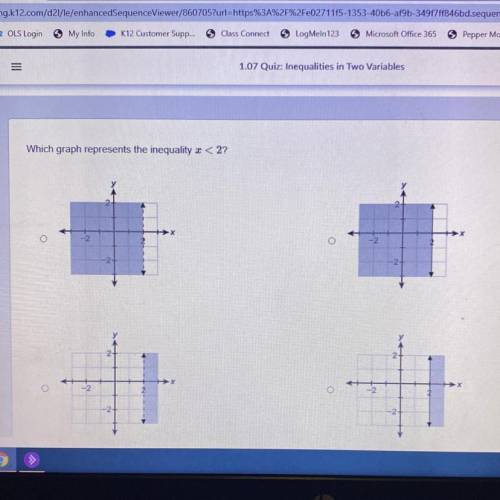
Which graph represents the inequality x<2?
...

Mathematics, 01.09.2020 14:01 andrwisawesome0
Which graph represents the inequality x<2?

Answers: 1


Other questions on the subject: Mathematics
Mathematics, 21.06.2019 19:00, filthyfish
Teams of 4 are competing in a 1/4 mile relay race. each runner must run the same exact distance. what is the distance each teammate runs?
Answers: 1
Mathematics, 21.06.2019 21:40, skylarbrown018
The number of chocolate chips in a bag of chocolate chip cookies is approximately normally distributed with a mean of 12611261 chips and a standard deviation of 118118 chips. (a) determine the 2626th percentile for the number of chocolate chips in a bag. (b) determine the number of chocolate chips in a bag that make up the middle 9696% of bags. (c) what is the interquartile range of the number of chocolate chips in a bag of chocolate chip cookies?
Answers: 2
Mathematics, 21.06.2019 23:00, dianereyes7475
The angles in a triangle are represented by 5x, 8x, and 2x+9. what is the value of ? a.10.8 b.11.4 c.9.7 d.7.2
Answers: 2
Mathematics, 21.06.2019 23:00, abbymoses3
Someone answer this asap for the function f(x) and g(x) are both quadratic functions. f(x) = x² + 2x + 5 g(x) = x² + 2x - 1 which statement best describes the graph of g(x) compared to the graph of f(x)? a. the graph of g(x) is the graph of f(x) shifted down 1 units. b. the graph of g(x) is the graph of f(x) shifted down 6 units. c. the graph of g(x) is the graph of f(x) shifted to the right 1 unit. d. the graph of g(x) is the graph of f(x) shifted tothe right 6 units.
Answers: 3
You know the right answer?
Questions in other subjects:
Mathematics, 05.10.2020 15:01
Mathematics, 05.10.2020 15:01

Biology, 05.10.2020 15:01

Mathematics, 05.10.2020 15:01

English, 05.10.2020 15:01


