
Mathematics, 30.08.2020 01:01 PoPFli21
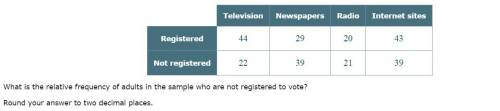
A sample of 257 adults is selected. The adults are classified according to voter registration status ("registered" or "not registered"). They are also classified according to preferred source of current events information ("television", "newspapers", "radio", or "internet sites"). The results are given in the contingency table below. What is the relative frequency of adults in the sample who are not registered to vote? Round your answer to two decimal places.

Answers: 1


Other questions on the subject: Mathematics
Mathematics, 21.06.2019 15:10, daniiltemkin20
Which equation represents the partial sum of the geometric series?
Answers: 1
Mathematics, 21.06.2019 16:20, bestballer7095
Aclass consists of 55% boys and 45% girls. it is observed that 25% of the class are boys and scored an a on the test, and 35% of the class are girls and scored an a on the test. if a student is chosen at random and is found to be a girl, the probability that the student scored an ais
Answers: 2
Mathematics, 21.06.2019 23:40, Quidlord03
Which is the scale factor proportion for the enlargement shown?
Answers: 1
You know the right answer?
A sample of 257 adults is selected. The adults are classified according to voter registration status...
Questions in other subjects:
Mathematics, 06.05.2021 20:00

Mathematics, 06.05.2021 20:00
Mathematics, 06.05.2021 20:00

Mathematics, 06.05.2021 20:00

Mathematics, 06.05.2021 20:00


