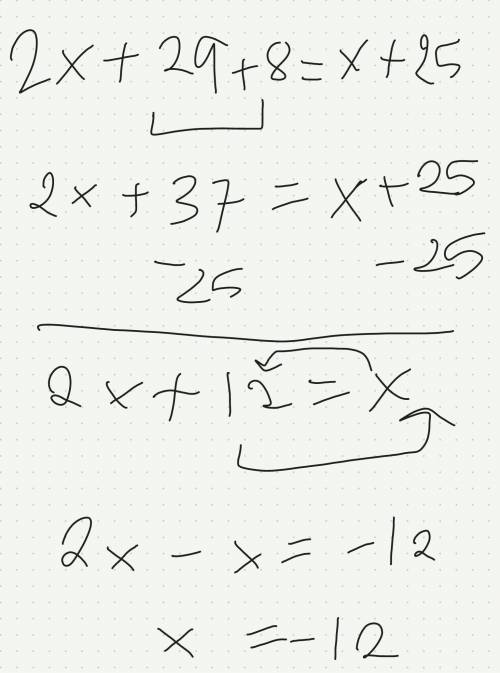
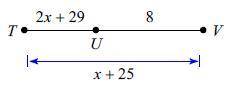
Solve for x (image below)
...

Mathematics, 29.08.2020 15:01 tefanyc13
Solve for x (image below)

Answers: 3


Other questions on the subject: Mathematics
Mathematics, 21.06.2019 15:00, Shavaila18
The data shown in the table below represents the weight, in pounds, of a little girl, recorded each year on her birthday. age (in years) weight (in pounds) 2 32 6 47 7 51 4 40 5 43 3 38 8 60 1 23 part a: create a scatter plot to represent the data shown above. sketch the line of best fit. label at least three specific points on the graph that the line passes through. also include the correct labels on the x-axis and y-axis. part b: algebraically write the equation of the best fit line in slope-intercept form. include all of your calculations in your final answer. part c: use the equation for the line of best fit to approximate the weight of the little girl at an age of 14 years old.
Answers: 3
Mathematics, 21.06.2019 21:30, xaguilar
Data from 2005 for various age groups show that for each $100 increase in the median weekly income for whites, the median weekly income of blacks increases by $105. also, for workers of ages 25 to 54 the median weekly income for whites was $676 and for blacks was $527. (a) let w represent the median weekly income for whites and b the median weekly income for blacks, and write the equation of the line that gives b as a linear function of w. b = (b) when the median weekly income for whites is $760, what does the equation in (a) predict for the median weekly income for blacks?
Answers: 2
You know the right answer?
Questions in other subjects:

Biology, 18.11.2020 16:40
Mathematics, 18.11.2020 16:40


