
Mathematics, 27.08.2020 23:01 aidanw
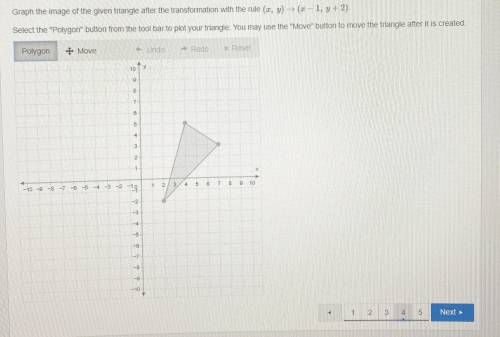
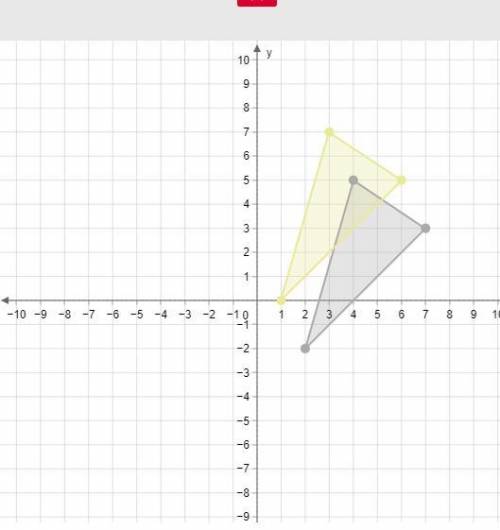
Graph the image of the given triangle after the transformation with the rule (x, y)→(x−1, y+2). Select the "Polygon" button from the tool bar to plot your triangle. You may use the "Move" button to move the triangle after it is created.

Answers: 1


Other questions on the subject: Mathematics
Mathematics, 21.06.2019 17:30, Jcmandique3444
Consider the graph of the exponential function y=3(2)×
Answers: 1
Mathematics, 21.06.2019 22:00, danielahalesp87vj0
18 16 11 45 33 11 33 14 18 11 what is the mode for this data set
Answers: 2
You know the right answer?
Graph the image of the given triangle after the transformation with the rule (x, y)→(x−1, y+2). Sele...
Questions in other subjects:

Social Studies, 17.10.2019 00:40


Spanish, 17.10.2019 00:40


Chemistry, 17.10.2019 00:40
Chemistry, 17.10.2019 00:40


