Which term describes the red curve in the figure below?
O A. Ellipse
B. Hyperbola
O C....

Mathematics, 26.08.2020 06:01 alexedwards307
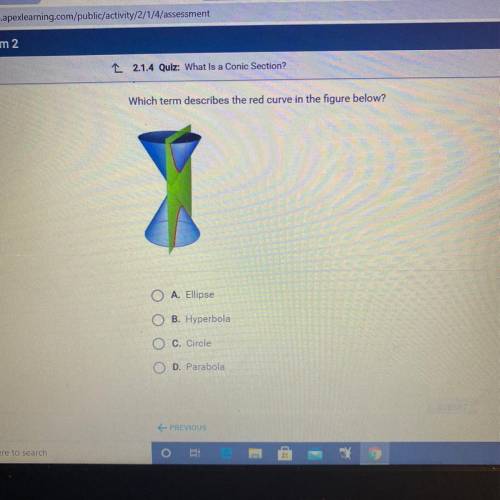
Which term describes the red curve in the figure below?
O A. Ellipse
B. Hyperbola
O C. Circle
O D. Parabola

Answers: 2


Other questions on the subject: Mathematics
Mathematics, 21.06.2019 13:00, danielle413
Renita analyzed two dot plots showing the snowfall during the winter months for city a and for city b. she found that the median snowfall is 5 inches less in city a than in city b. the mean snowfall is about 2 inches less in city a than in city b. which explains why there is a difference in the measures of center for the sets of data?
Answers: 3
Mathematics, 21.06.2019 16:00, ericavasquez824
The graph shows the distance y, in inches, a pendulum moves to the right (positive displacement) and to the left (negative displacement), for a given number of seconds x. how many seconds are required for the pendulum to move from its resting position and return? enter your answer in the box.
Answers: 2
Mathematics, 21.06.2019 18:00, dizzleman3030
Find the perimeter of the figure shown above. a. 40 cm c. 52 cm b. 60 cm d. 75 cm select the best answer from the choices provided
Answers: 1
You know the right answer?
Questions in other subjects:

Chemistry, 20.10.2020 14:01
Mathematics, 20.10.2020 14:01


English, 20.10.2020 14:01

Health, 20.10.2020 14:01
Mathematics, 20.10.2020 14:01


