Mathematics, 27.08.2020 03:01 english7750
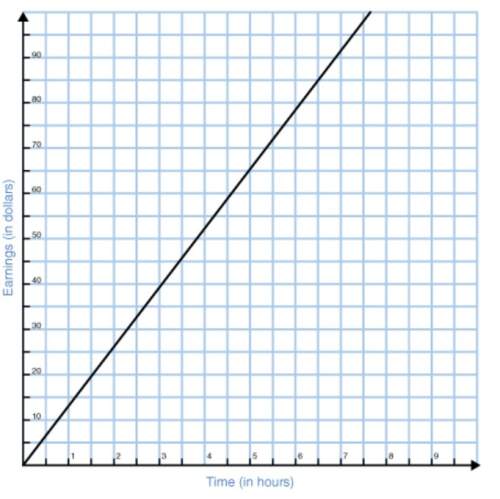
Going to school Students in a high school statistics class were given data about the main method of transportation to school for a group of 30 students. They produced the pictograph shown. Explain how this graph is misleading.

Answers: 1


Other questions on the subject: Mathematics

Mathematics, 21.06.2019 17:00, ladnerhailey16
What is sin 7x/4 ? i need on this urgent trig
Answers: 1


Mathematics, 21.06.2019 19:20, docholiday
Math each whole number with a rational, exponential expression
Answers: 1
You know the right answer?
Going to school Students in a high school statistics class were given data about the main method of...
Questions in other subjects:


Biology, 09.08.2021 20:40


Mathematics, 09.08.2021 20:40


Biology, 09.08.2021 20:40

Physics, 09.08.2021 20:40


