
Mathematics, 25.08.2020 21:01 alee885
M 1
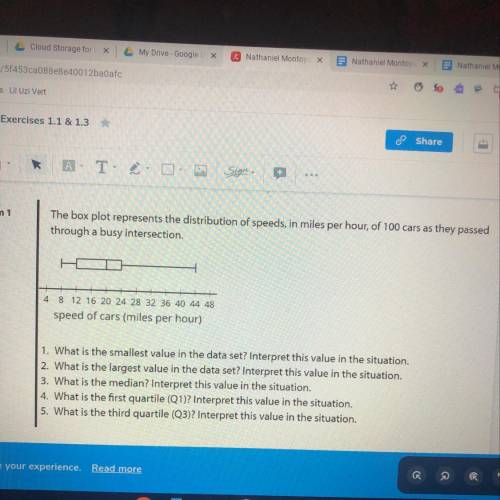
The box plot represents the distribution of speeds, in miles per hour, of 100 cars as they passed
through a busy intersection.
4
8 12 16 20 24 28 32 36 40 44 48
speed of cars (miles per hour)
1. What is the smallest value in the data set? Interpret this value in the situation.
2. What is the largest value in the data set? Interpret this value in the situation.
3. What is the median? Interpret this value in the situation.
4. What is the first quartile (Q1)? Interpret this value in the situation.
5. What is the third quartile (Q3)? Interpret this value in the situation.

Answers: 1


Other questions on the subject: Mathematics
Mathematics, 21.06.2019 21:30, adam15200031
Yesterday, george drank 1 small bottle and 2 large bottles, for a total of 1,372 grams. the day before , he drank 1 small bottle and 1 large bottle, for the total of 858 grams. how many grams does each bottle hold?
Answers: 1
Mathematics, 22.06.2019 00:30, Delgadojacky0206
The water company charges a residential customer $41 for the first 3,000 gallons of water used and $1 for every 200 gallons used over 3000 gallons. if the water bill was $58 how many gallons of water were usedanswersa 3400 gallonsb 6000 gallonsc 6400 gallons d 7000 gallons
Answers: 2
You know the right answer?
M 1
The box plot represents the distribution of speeds, in miles per hour, of 100 cars as they pass...
Questions in other subjects:


Mathematics, 01.11.2020 03:50
English, 01.11.2020 03:50
Mathematics, 01.11.2020 03:50


