
Mathematics, 25.08.2020 22:01 lupitaca888
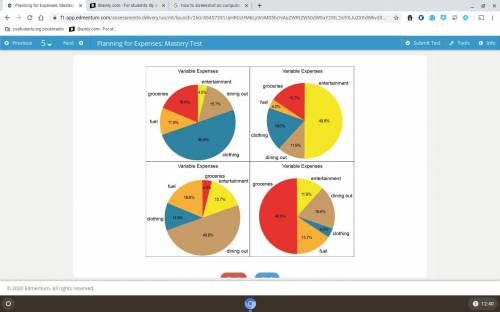
Select the pie chart that accurately represents Sabrina’s variable expenses for the month of June. Sabrina compiled a list of her variable expenses for the month of June to analyze her spending habits.

Answers: 1


Other questions on the subject: Mathematics
Mathematics, 21.06.2019 19:00, gharrell03
Satchi found a used bookstore that sells pre-owned dvds and cds. dvds cost $9 each, and cds cost $7 each. satchi can spend no more than $45.
Answers: 1
Mathematics, 21.06.2019 23:30, jadenweisman1
The approximate line of best fit for the given data points, y = −2x − 2, is shown on the graph. which is the residual value when x = –2? a)–2 b)–1 c)1 d)2
Answers: 2
Mathematics, 21.06.2019 23:40, preciosakassidy
The frequency table shows the results of a survey asking people how many hours they spend online per week. on a piece of paper, draw a histogram to represent the data. then determine which answer choice matches the histogram you drew. in order here is the.. hours online: 0-3, 4-7, 8-11, 12-15, and 16-19. frequency: 5, 8, 10, 8, 7 answer for the question is in the picture! : )
Answers: 2
You know the right answer?
Select the pie chart that accurately represents Sabrina’s variable expenses for the month of June. S...
Questions in other subjects:

Mathematics, 22.08.2019 04:30

History, 22.08.2019 04:30

Mathematics, 22.08.2019 04:30
Mathematics, 22.08.2019 04:30

Social Studies, 22.08.2019 04:30


