
Mathematics, 23.08.2020 01:01 amberunderhill
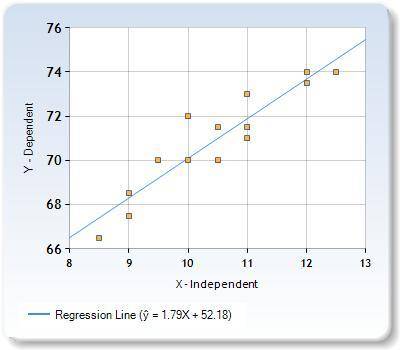
The accompanying data are the shoe sizes and heights (in inches) of 14 men. Find the equation of the regression line. Then construct a scatter plot of the data and draw the regression line. Then use the regression equation to predict the value of y for each of the given x-values, if meaningful. If the x-value is not meaningful to predict the value of y, explain why not.
(a) x= 11.5
(b) x= 8.0
(c) x = 15.5
(d) x = 10.0

Answers: 1


Other questions on the subject: Mathematics
Mathematics, 21.06.2019 19:00, alyo31500
Graph g(x)=2cosx . use 3.14 for π . use the sine tool to graph the function. graph the function by plotting two points. the first point must be on the midline and closest to the origin. the second point must be a maximum or minimum value on the graph closest to the first point.
Answers: 1
Mathematics, 21.06.2019 20:30, gamelaza431
At the "no mutants allowed" country farm, every sheep has 4 legs, every chicken has two legs, and all animals have only 1 head. asked to count how many sheep and chicken are in the fields, a farm boy reports back that there are 140 feet and 50 heads. how many sheep and chicken are there? there are sheep and chicken at the farm.
Answers: 1
Mathematics, 21.06.2019 21:40, carson5238
If angle b measures 25°, what is the approximate perimeter of the triangle below? 10.3 units 11.8 units 22.1 units 25.2 units
Answers: 2
Mathematics, 22.06.2019 00:30, vladisking888
How can you find the magnitude of a vector, v = < x, y > , where the horizontal change is x and the vertical change is y?
Answers: 1
You know the right answer?
The accompanying data are the shoe sizes and heights (in inches) of 14 men. Find the equation of the...
Questions in other subjects:

Computers and Technology, 02.12.2021 01:30

Mathematics, 02.12.2021 01:30

Spanish, 02.12.2021 01:30

Mathematics, 02.12.2021 01:30


