
Mathematics, 21.08.2020 18:01 mathiscool51
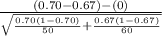
Find the standardized test statistic, z to test the hypothesis that p1 = p2. Use α = 0.05. The sample statistics listed below are from independent samples. Sample statistics: n1 = 50, x1 = 35, and n2 = 60, x2 = 40

Answers: 2
 :
: 
 :
: 
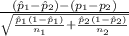 ~ N(0,1)
 = sample proportion of the first sample =
  =
=  = 0.70
 = sample proportion of the second sample =
  =
=  = 0.67
 = size of the first sample = 50
 = size of the first sample = 60


Other questions on the subject: Mathematics
Mathematics, 22.06.2019 01:00, s27511583
The weight of 46 new patients of a clinic from the year 2018 are recorded and listed below. construct a frequency distribution, using 7 classes. then, draw a histogram, a frequency polygon, and an ogive for the data, using the relative information from the frequency table for each of the graphs. describe the shape of the histogram. data set: 130 192 145 97 100 122 210 132 107 95 210 128 193 208 118 196 130 178 187 240 90 126 98 194 115 212 110 225 187 133 220 218 110 104 201 120 183 124 261 270 108 160 203 210 191 180 1) complete the frequency distribution table below (add as many rows as needed): - class limits - class boundaries - midpoint - frequency - cumulative frequency 2) histogram 3) frequency polygon 4) ogive
Answers: 1
Mathematics, 22.06.2019 01:10, onlymyworld27
To find the inverse of a number a, one can use the equation f(c) = a-1/c=0 where c is the inverse of a use the secant method of finding roots of equations to find the inverse of a = 2.5 ,er = 0.001%
Answers: 3
Mathematics, 22.06.2019 02:30, djohnson11461
Given: lkm jkm, clmk prove: alkmajkm jmk. choose the word that completes the sentence correctly. proof: lkm jkm and lmk * umk are given. km km by the property of congruence. equivalence symmetric reflexive transitive
Answers: 1
You know the right answer?
Find the standardized test statistic, z to test the hypothesis that p1 = p2. Use α = 0.05. The sampl...
Questions in other subjects:
Mathematics, 12.03.2020 18:36


Physics, 12.03.2020 18:36


