
Mathematics, 20.08.2020 18:01 tess92
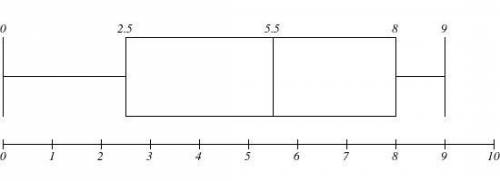
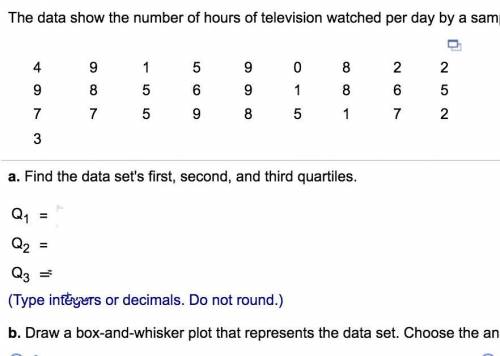
The data show the number of hours of television watched per day by a sample of people. Use technology to answer parts (a) and (b) below. a. Find the data set's first, second, and third quartiles. nothing nothing nothing (Type integers or decimals. Do not round.) b. Draw a box-and-whisker plot that represents the data set. Choose the answer below. Note that different technologies will produce slightly different results. A. 0 3 6 9 A boxplot has a horizontal axis labeled from 0 to 10 in increments of 1. Vertical line segments are drawn at the following plotted points: 0, 1, 6, 7, 9. A box encloses the vertical line segments at 1, 6, and 7 and horizontal line segments extend outward from both sides of the box to vertical line segments at 0 and 9. All values are approximate. B. 0 3 6 9 A boxplot has a horizontal axis labeled from 0 to 10 in increments of 1. Vertical line segments are drawn at the following plotted points: 0, 3, 6, 7, 9. A box encloses the vertical line segments at 3, 6, and 7 and horizontal line segments extend outward from both sides of the box to vertical line segments at 0 and 9. All values are approximate. C. 0 3 6 9

Answers: 2


Other questions on the subject: Mathematics
Mathematics, 21.06.2019 18:00, roseemariehunter12
Ammonia molecules have three hydrogen atoms and one nitrogen atom. how many of each atom arein five molecules of ammonia
Answers: 1
Mathematics, 22.06.2019 01:00, allysongonzalezlove0
Ineed to know how to write question one in mathematical terms
Answers: 1
You know the right answer?
The data show the number of hours of television watched per day by a sample of people. Use technolog...
Questions in other subjects:


Mathematics, 16.12.2020 16:20


