
Mathematics, 20.08.2020 16:01 deannajd03
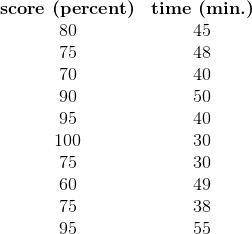
A teacher records the amount of time it took a random sample of students to finish a test and their scores on that test. Let x be the score and y be the amount of time. Conduct a hypothesis test of the claim that there is a linear correlation between the variables, using a 0.10 level of significance. Find the PERCENTAGE OF THE VARIANCE IN THE Y-VALUES THAT CAN BE EXPLAINED BY THEIR LINEAR RELATIONSHIP WITH THE X-VALUES.

Answers: 3


Other questions on the subject: Mathematics
Mathematics, 21.06.2019 18:30, waldruphope3956
Can someone check if i did this right since i really want to make sure it’s correct. if you do you so much
Answers: 2
Mathematics, 21.06.2019 21:30, celeste961
Write 5(6x+4)-2(5x-2) in the form a(bx+c) where a, b and c integers and a> 1
Answers: 2
Mathematics, 21.06.2019 21:30, jarviantemelton
Consider the following equation. 1/2x^3+x-7=-3sqrtx-1 approximate the solution to the equation using three iterations of successive approximation. use the graph below as a starting point. a. b. c. d.
Answers: 3
Mathematics, 21.06.2019 23:00, tonimgreen17p6vqjq
Which graph represents the linear function below? y-3=1/2(x+2)
Answers: 2
You know the right answer?
A teacher records the amount of time it took a random sample of students to finish a test and their...
Questions in other subjects:


Computers and Technology, 04.01.2021 02:10


