
Mathematics, 20.08.2020 20:01 mattmaddox86
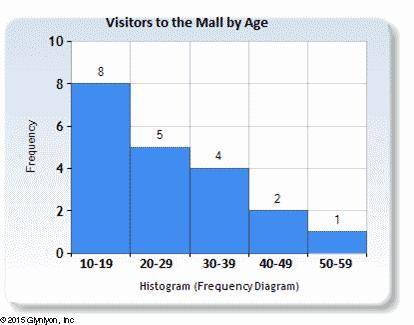
This histogram represents a sampling of recent visitors to the mall on a Friday night, grouped by their ages. If you knew the exact values of the data points for this data set, which measure of center (the mean or median) would most likely provide a more accurate picture of the data set? Explain your reasoning. Need help Asap

Answers: 2


Other questions on the subject: Mathematics
Mathematics, 21.06.2019 17:00, figueroajorge8291
Joseph haydn pet store offers wide variety of leashes for dogs. the store purchases one popular type of leash from its manufacturer for $4.38 each. joseph haydn pets marks up leashes at a rate of 238% of cost. what is the retail price of the popular leash?
Answers: 1
Mathematics, 21.06.2019 23:40, redhot12352
For a science project, a high school research team conducted a survey of local air temperatures. based on the results of the survey, the found that the average temperatures were around 10 degrees higher than expected. this result was wrong. the trouble with the survey was that most of the locations were exposed to direct sunlight and located over asphalt or sand, which resulted in higher temperatures than normal. this is a classic example of an error in which phase of inferential statistics?
Answers: 1
You know the right answer?
This histogram represents a sampling of recent visitors to the mall on a Friday night, grouped by th...
Questions in other subjects:
Mathematics, 17.12.2020 01:00
Mathematics, 17.12.2020 01:00


History, 17.12.2020 01:00
Mathematics, 17.12.2020 01:00
History, 17.12.2020 01:00
Mathematics, 17.12.2020 01:00


