
Mathematics, 17.08.2020 22:01 rwma
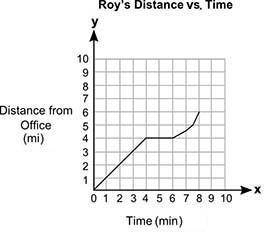
The graph below shows Roy's distance from his office (y), in miles, after a certain amount of time (x), in minutes: Graph titled Roys Distance Vs Time shows 0 to 10 on x and y axes at increments of 1.The label on x axis is time in minutes and that on y axis is Distance from Office in miles. Lines are joined at the ordered pairs 0, 0 and 1, 1 and 2, 2 and 3, 3 and 4, 4 and 5, 4 and 6, 4 and 7, 4.5 and 7.5, 5 and 8, 6. Four students described Roy's motion, as shown in the table below: Student Description Peter He drives a car at a constant speed for 4 minutes, then stops at a crossing for 6 minutes, and finally drives at a variable speed for the next 2 minutes. Shane He drives a car at a constant speed for 4 minutes, then stops at a crossing for 2 minutes, and finally drives at a variable speed for the next 8 minutes. Jamie He drives a car at a constant speed for 4 minutes, then stops at a crossing for 6 minutes, and finally drives at a variable speed for the next 8 minutes. Felix He drives a car at a constant speed for 4 minutes, then stops at a crossing for 2 minutes, and finally drives at a variable speed for the next 2 minutes. Which student most accurately described Roy's motion? Peter Shane Jamie Felix

Answers: 3


Other questions on the subject: Mathematics
Mathematics, 21.06.2019 16:30, Hfruit
You drop a rubber ball off the roof of a 50 meter high building onto a paved parking lot. it bounces back up with every bounce, but not quite all the way back up to you. after the first bounce it bounces back only 80 percent of the distance it was dropped from. the pattern continues, meaning after every bounce it comes up to just 80 percent of the previous maximum height. so if before the first bounce the height is 50 meters, what height does the ball reach after the fifth bounce? round your answer to one decimal place and chose the correct response from the choices below:
Answers: 1
Mathematics, 21.06.2019 17:00, saltytaetae
The tuition costs, c, for a local community college are modeled by c(h) = 250 + 200h, where h represents the number of credit hours taken. the local state university has tuition costs, s, modeled by the function s(h) = 300 + 180h. how many credit hours will a student have to take for the two tuition costs to be equal? round the answer to the nearest tenth of an hour.
Answers: 3
Mathematics, 21.06.2019 18:40, stephen4438
Which of the following represents the range of the graph of f(x) below
Answers: 1
Mathematics, 22.06.2019 01:30, colebash88
Paco orders an ice cream for $1, but realizes his wallet is at home and he only has 3/20 of $1 with him. if his mom pays the remaining 7/20 of the dollar, how much will she pay? $0.05 $0.15 $0.85 $0.95
Answers: 1
You know the right answer?
The graph below shows Roy's distance from his office (y), in miles, after a certain amount of time (...
Questions in other subjects:
Mathematics, 08.01.2021 21:00
Mathematics, 08.01.2021 21:00


Mathematics, 08.01.2021 21:00

Chemistry, 08.01.2021 21:00

Biology, 08.01.2021 21:00
Chemistry, 08.01.2021 21:00


