
Mathematics, 18.08.2020 22:01 jjjoooorrrrddddaannn
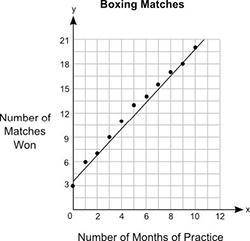
The graph below shows the relationship between the number of months different students practiced boxing and the number of matches they won: The title of the graph is Boxing Matches. On x axis, the label is Number of Months of Practice. On y axis, the label is Number of Matches Won. The scale on the y axis is from 0 to 21 at increments of 3, and the scale on the x axis is from 0 to 12 at increments of 2. The points plotted on the graph are the ordered pairs 0, 3 and 1, 6 and 2, 7 and 3, 9 and 4, 11 and 5, 13 and 6, 14 and 7, 16 and 8, 17 and 9, 18 and 10,20. A straight line is drawn joining the ordered pairs 0, 4 and 2, 7.1 and 4, 11 and 6, 13.5 and 8, 17 and 10, 20.5. Part A: What is the approximate y-intercept of the line of best fit and what does it represent? (5 points) Part B: Write the equation for the line of best fit in the slope-intercept form and use it to predict the number of matches that could be won after 13 months of practice. Show your work and include the points used to calculate the slope. (5 points)

Answers: 3


Other questions on the subject: Mathematics
Mathematics, 21.06.2019 22:00, Isaiahgardiner5143
Arefrigeration system at your company uses temperature sensors fixed to read celsius (°c) values, but the system operators in your control room understand only the fahrenheit scale. you have been asked to make a fahrenheit (°f) label for the high temperature alarm, which is set to ring whenever the system temperature rises above –10°c. what fahrenheit value should you write on the label?
Answers: 3
Mathematics, 21.06.2019 22:00, mileto1798
Write a description of each inequality. 1. -5a + 3 > 1 2. 27 - 2b < -6 (this < has a _ under it) 3. 1/2 (c + 1) > 5 (this > has a _ under it)
Answers: 3
You know the right answer?
The graph below shows the relationship between the number of months different students practiced box...
Questions in other subjects:

Mathematics, 13.01.2021 20:30

Chemistry, 13.01.2021 20:30


History, 13.01.2021 20:30
History, 13.01.2021 20:30
Mathematics, 13.01.2021 20:30
English, 13.01.2021 20:30


