
Mathematics, 17.08.2020 05:01 kritalewis
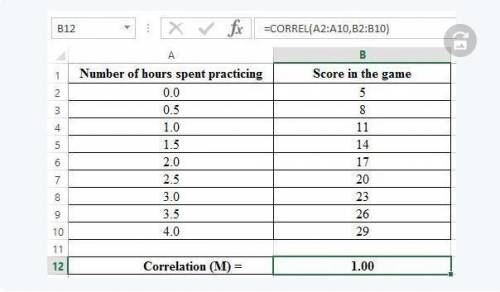
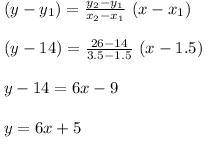
A coach is assessing the correlation between the number of hours spent practicing and the average number of points scored in a game. The table shows the data: Number of hours spent practicing (x)00.511.522.533.54 Score in the game (y)5811141720232629 Part A: Is there any correlation between the number of hours spent practicing and the score in the game? Justify your answer. (4 points) Part B: Write a function that best fits the data. (3 points) Part C: What does the slope and y-intercept of the plot indicate? (3 points)

Answers: 2


Other questions on the subject: Mathematics
Mathematics, 21.06.2019 15:10, wanderlay29
Which system of linear inequalities is graphed? can somebody please
Answers: 3
Mathematics, 21.06.2019 19:30, chellybean
If (17, 4) is an ordered pair of the inverse of f(x), which of the following is an ordered pair of the function f(x)? a. (17,4) b. (4.17) c. (4,0) d. 0,17)
Answers: 2
Mathematics, 21.06.2019 19:50, adjjones2011
The probability that an adult possesses a credit card is .70. a researcher selects two adults at random. by assuming the independence, the probability that the first adult possesses a credit card and the second adult does not possess a credit card is:
Answers: 3
Mathematics, 21.06.2019 21:30, foreverandalways80
Joanie wrote a letter that was 1 1/4 pages long. katie wrote a letter that was 3/4 page shorter then joagies letter. how long was katies letter
Answers: 1
You know the right answer?
A coach is assessing the correlation between the number of hours spent practicing and the average nu...
Questions in other subjects:
Mathematics, 03.01.2021 19:20
Mathematics, 03.01.2021 19:20
Mathematics, 03.01.2021 19:20

Biology, 03.01.2021 19:20
Mathematics, 03.01.2021 19:20


