
Mathematics, 17.08.2020 01:01 120175
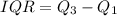
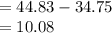
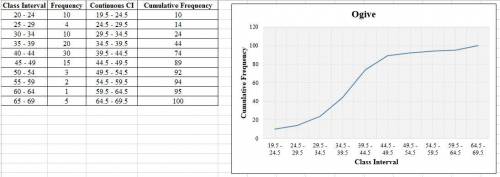
The following table shows scores obtained in an examination by B. Ed JHS Specialism students. Use the information to answer the questions that follow: Score 20-24 25-29 30-34 35-39 40-44 45-49 50-54 55-59 60-64 65-69 Frequency 10 4 10 20 30 15 3 2 1 5.a. Construct a cumulative frequency curve for the data. b. Find the; i. inter-quartile range. ii. 70th percentile class scores. iii. probability that a student scored at most 50 on the examination Please is urgent .can I get help

Answers: 1
![Q_{1}=l+[\frac{(\sum f/4)-(CF)_{p}}{f}]\times h](/tpl/images/0723/2391/19830.png)
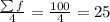
 = cumulative frequency of the previous class = 24
![=34.5+[\frac{25-24}{20}]\times5\\\\=34.5+0.25\\=34.75](/tpl/images/0723/2391/afa09.png)
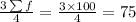
![Q_{3}=l+[\frac{(3\sum f/4)-(CF)_{p}}{f}]\times h](/tpl/images/0723/2391/4a744.png)
![=44.5+[\frac{75-74}{15}]\times5\\\\=44.5+0.33\\=44.83](/tpl/images/0723/2391/0202c.png)


Other questions on the subject: Mathematics
Mathematics, 21.06.2019 19:30, tyeni2crazylolp7a3hk
If chord ab is congruent to chord cd, then what must be true about ef and eg?
Answers: 1
You know the right answer?
The following table shows scores obtained in an examination by B. Ed JHS Specialism students. Use th...
Questions in other subjects:
Mathematics, 07.01.2021 18:20

Chemistry, 07.01.2021 18:20
Mathematics, 07.01.2021 18:20

Computers and Technology, 07.01.2021 18:20

Health, 07.01.2021 18:20
Mathematics, 07.01.2021 18:20
Mathematics, 07.01.2021 18:20

Arts, 07.01.2021 18:20
Mathematics, 07.01.2021 18:20


