
Mathematics, 15.08.2020 20:01 thedocgalloway
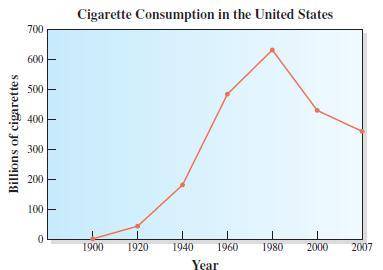
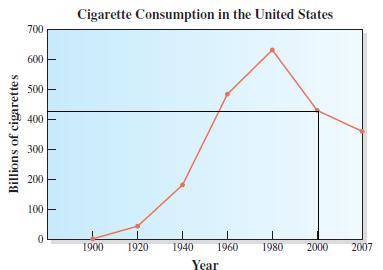
The given graph shows the cigarette consumption (in billions) in the United States for the years 1900 to
2007
Choose the best estimate for the number of cigarettes smoked in 2000.
420 billion
Qi 400 billion
380 billion
450 billion

Answers: 2


Other questions on the subject: Mathematics
Mathematics, 21.06.2019 14:00, Gheaton1889
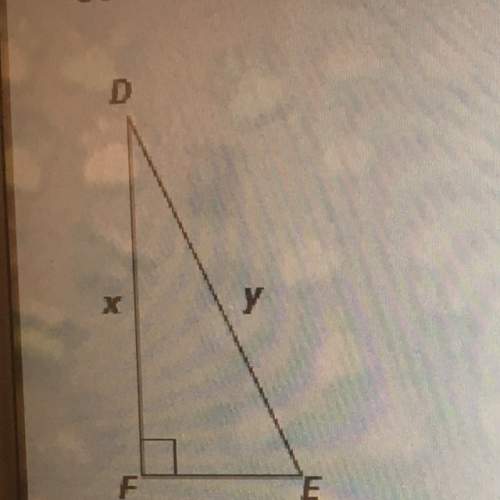
Find the length of cu, the triangles are similar.
Answers: 2
Mathematics, 21.06.2019 20:20, bbyjoker
Recall that the owner of a local health food store recently started a new ad campaign to attract more business and wants to know if average daily sales have increased. historically average daily sales were approximately $2,700. the upper bound of the 95% range of likely sample means for this one-sided test is approximately $2,843.44. if the owner took a random sample of forty-five days and found that daily average sales were now $2,984, what can she conclude at the 95% confidence level?
Answers: 1
Mathematics, 21.06.2019 23:00, BeautyxQueen
Who long does it take to drive 150 miles at 45 miles per hour
Answers: 2
You know the right answer?
The given graph shows the cigarette consumption (in billions) in the United States for the years 190...
Questions in other subjects:

Social Studies, 22.07.2021 03:30
Mathematics, 22.07.2021 03:30

Social Studies, 22.07.2021 03:30
Mathematics, 22.07.2021 03:40


History, 22.07.2021 03:40
Mathematics, 22.07.2021 03:40


